How To Use The Ghost Tangent Crossings Indicator On TradingView In Forex Trading
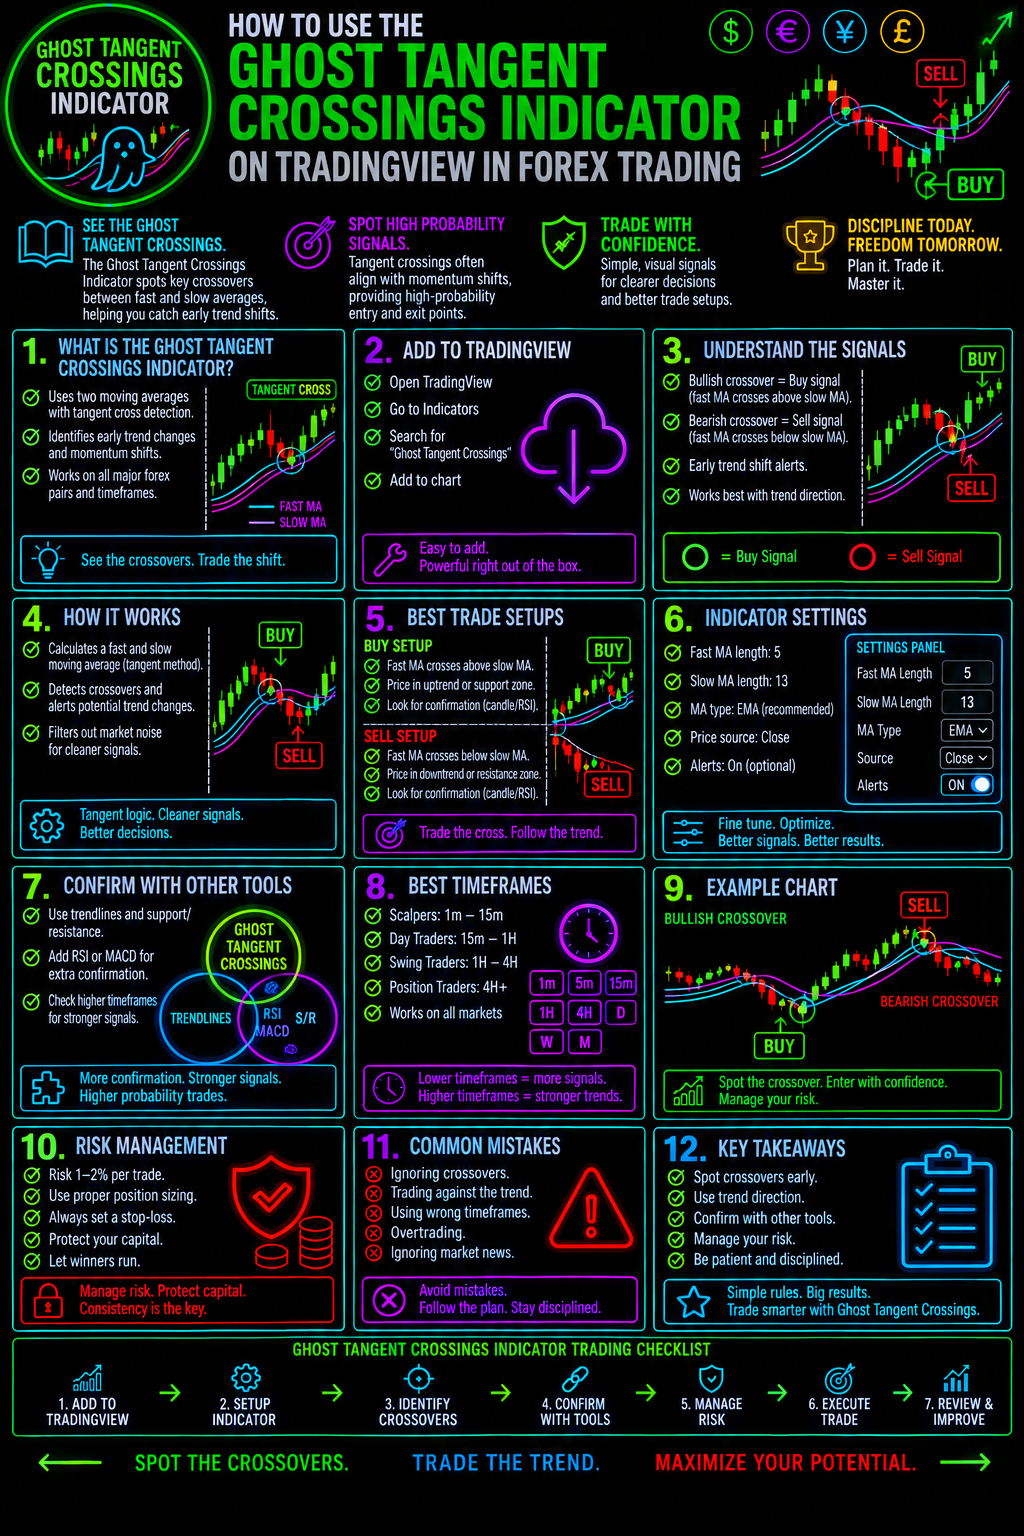
Turn Indicator Crossings Into Actionable Forex Trade Information
Forex traders are constantly searching for better ways to identify trend changes, momentum shifts, potential entries, and changing market conditions.
The Ghost Tangent Crossings Indicator on TradingView can give traders another layer of information when analyzing price movement and looking for potential trading opportunities.
But simply adding an indicator to a chart isn't enough.
The real advantage comes from understanding what the indicator is telling you, when its signals matter, and how to combine those signals with price action, trend analysis, support and resistance, and disciplined risk management.
In this guide, you'll learn how to use the Ghost Tangent Crossings Indicator in Forex trading and how to incorporate it into a broader trading process.
Don't trade the indicator alone. Learn how to build the complete setup.
What Is The Ghost Tangent Crossings Indicator?
The Ghost Tangent Crossings Indicator is a TradingView technical-analysis tool designed to help traders identify potential changes in market direction through crossing behavior and related price movement.
The concept is particularly useful because markets constantly transition between:
- Trending conditions
- Consolidation
- Momentum expansion
- Momentum contraction
- Potential reversals
- Continuation moves
Instead of attempting to predict every market movement, traders can use an indicator such as Ghost Tangent Crossings as part of a structured process for evaluating whether the market is potentially changing character.
This makes the indicator most valuable when it is used as confirmation rather than as an isolated buy-or-sell machine.
Why Forex Traders Should Pay Attention To Indicator Crossings
Crossings can provide traders with a visual representation of changing market conditions.
A crossing may suggest that the relationship between the indicator's underlying components is changing.
That can become particularly interesting when the crossing occurs near an important technical area.
For example:
Crossing + Support + Bullish Price Action
may create a more compelling bullish setup than the crossing alone.
Likewise:
Crossing + Resistance + Bearish Price Action
may provide stronger evidence for a potential bearish opportunity.
This is where technical analysis becomes more powerful.
You're not simply asking:
"Did the indicator cross?"
You're asking:
"What is the market doing when the crossing occurs?"
How To Add Ghost Tangent Crossings To TradingView
Adding an indicator to your TradingView chart is straightforward.Step 1: Open TradingView
Open your TradingView chart and select the Forex market you want to analyze.
Popular markets include:
Step 2: Open The Indicators Menu
Select Indicators at the top of your TradingView chart.
Search for:
Ghost Tangent Crossings
Select the appropriate indicator from the available results.
Step 3: Add It To Your Chart
Once added, examine how the indicator behaves relative to historical price movement.
Don't immediately begin taking trades.
First, study the relationship between:
Price → Crossing → Trend → Market Structure
This simple observation period can help you understand how the indicator behaves in different market environments.
How To Read Ghost Tangent Crossings
The most important skill isn't adding the indicator.
It's learning how to interpret what you're seeing.
A crossing can potentially become more meaningful when it agrees with the broader market structure.
Look for several pieces of information.
1. The Direction Of The Crossing
First determine whether the crossing is suggesting bullish or bearish conditions according to the indicator's plotted components.
A bullish-looking crossing may attract buyers.
A bearish-looking crossing may attract sellers.
But don't stop there.
2. The Existing Trend
Ask:
Is the market already trending?
If the market is strongly bullish and the indicator produces a bullish crossing, the signal may be consistent with trend continuation.
If the market is strongly bearish and the indicator produces a bearish crossing, the same principle applies.
Trend alignment can help separate potential continuation setups from signals occurring against the dominant market direction.
Ghost Tangent Crossings For Trend Continuation
One of the most useful ways to approach any crossing-based indicator is to look for signals that occur in the direction of an established trend.
Consider a bullish Forex market.
Price is making:
Higher Highs → Higher Lows → Higher Highs
Then the market temporarily pulls back.
If the Ghost Tangent Crossings Indicator produces a bullish crossing while price begins showing renewed bullish behavior, the crossing can become an additional confirmation factor.
The objective isn't to buy simply because the crossing occurred.
The objective is to determine whether multiple pieces of evidence are pointing in the same direction.A potential bullish confirmation sequence:
Established Uptrend
↓
Pullback
↓
Important Support Area
↓
Bullish Price Action
↓
Bullish Ghost Tangent Crossing
↓
Entry Evaluation
This type of process is far more structured than randomly entering whenever an indicator changes direction.
Ghost Tangent Crossings For Potential Trend Reversals
Crossings can also attract attention when they appear during a potential change in market direction.
Imagine EURUSD has been declining.
Price eventually reaches a major support zone.
Then you observe:
- Selling momentum begins weakening
- Price stops making meaningful new lows
- Bullish price action develops
- Market structure begins changing
- Ghost Tangent Crossings produces a bullish crossing
Now you have something worth investigating.
Notice the difference.
The crossing isn't being treated as proof that a reversal will occur.
Instead, it becomes one piece of evidence within a larger technical picture.
That distinction is critical.
Combine Ghost Tangent Crossings With Support And Resistance
Support and resistance can dramatically improve the context surrounding an indicator signal.
A crossing in the middle of a random trading range may be less compelling than a crossing occurring directly at a major technical level.Look for bullish crossings near:
- Previous swing lows
- Established support
- Demand zones
- Breakout retests
- Fibonacci retracement areas
- Major moving averages
Look for bearish crossings near:
- Previous swing highs
- Established resistance
- Supply zones
- Failed breakouts
- Fibonacci resistance areas
- Major moving averages
The goal is confluence.
You want multiple independent reasons for considering a trade.
Ghost Tangent Crossings + Price Action
Price remains the most important information on your chart.
Indicators are derived from price.
Therefore, when an indicator signal conflicts with obvious price behavior, traders should be cautious.
For example:
A bullish crossing occurs.
But price is simultaneously:
- Below major resistance
- Making lower highs
- Breaking support
- Showing aggressive bearish candles
That isn't automatically a bullish trade.
The indicator is providing information.
Price is providing context.
Learn more about reading candlestick behavior with the High Probability Japanese Candlestick Patterns Every Trader Must Know.
Use Multiple Timeframes For Better Context
One of the biggest mistakes traders make is analyzing an indicator on only one timeframe.
Forex markets are multi-timeframe environments.
A signal on the 5-minute chart exists inside the structure of the:
15-Minute → 1-Hour → 4-Hour → Daily
market.
For example, a trader may see a bullish Ghost Tangent Crossings signal on a 5-minute EUR/USD chart.
Before entering, ask:
What is the 1-hour trend?
Then:
Where is price relative to 4-hour support and resistance?
Then:
Is the larger market structure bullish, bearish, or ranging?
This can provide dramatically better context.
A Simple Multi-Timeframe Ghost Tangent Strategy
Consider using a three-timeframe framework.Higher Timeframe
Use the 4-hour or daily chart to determine the dominant market environment.
Ask:
- Bullish?
- Bearish?
- Range-bound?
- At major support?
- At major resistance?
Trading Timeframe
Move to the 1-hour or 15-minute chart.
Look for the market to establish a potential setup consistent with the higher timeframe.
Entry Timeframe
Use a lower timeframe to evaluate the actual entry.
Look for:
- Price-action confirmation
- Market-structure confirmation
- Ghost Tangent Crossing confirmation
- Defined stop-loss location
- Favorable risk-to-reward opportunity
This creates a top-down trading process instead of a single-indicator strategy.
Ghost Tangent Crossings Trading Setup
Here's a simple framework you can test.Bullish Setup
1. Identify an overall bullish market environment.
2. Locate a meaningful support area.
3. Wait for price to pull back toward that area.
4. Watch for bullish price-action confirmation.
5. Look for a bullish Ghost Tangent Crossing.
6. Define your entry.
7. Place a logical stop-loss.
8. Determine your profit target before entering.
9. Calculate your risk.
10. Execute only if the complete setup meets your rules.
Bearish Setup
Reverse the process.
1. Identify an overall bearish market environment.
2. Locate meaningful resistance.
3. Wait for price to rally into the area.
4. Look for bearish price action.
5. Watch for a bearish Ghost Tangent Crossing.
6. Define the entry.
7. Establish the stop-loss.
8. Determine the target.
9. Calculate the risk-to-reward ratio.
10. Execute only when the complete setup qualifies.
Don't Make This Common Trading Mistake
One of the easiest mistakes to make with a new TradingView indicator is assuming:
Signal = Trade
It doesn't.
A signal should trigger analysis, not an automatic order.
The strongest trading decisions generally come from confluence.
Think about your setup as a checklist:Trend
What direction is the market moving?Structure
Is price making higher highs, higher lows, lower highs, or lower lows?Location
Is price at an important technical area?Price Action
Is the candlestick behavior confirming the idea?Indicator
Is Ghost Tangent Crossings supporting the setup?Risk
Can the trade be structured with controlled downside?
When these factors align, you have a much more complete trading thesis.
Risk Management Comes Before The Entry
A great-looking setup can still become a terrible trade if risk isn't controlled.
Never allow an indicator to determine how much money you should risk.
Your position size should be based on:
Account Size + Risk Percentage + Stop-Loss Distance
A disciplined trader thinks about potential loss before thinking about potential profit.
If you are building your Forex trading foundation, our Forex Risk Management Guide can help you develop a more disciplined approach to position sizing, stop-loss placement, and capital preservation.
Build High-Probability Forex Setups
The Ghost Tangent Crossings Indicator shouldn't exist by itself.
It should become part of a repeatable trading system.
For example:
Trend
Support/Resistance
Candlestick Pattern
Ghost Tangent Crossing
Risk Management
=
Potential High-Probability Setup
The important word is potential.
No indicator can eliminate uncertainty from Forex trading.
Your objective is not to predict every trade correctly.
Your objective is to build a process where your risk is controlled and your best setups are consistently identified and executed.
Combine TradingView Indicators For Confluence
Ghost Tangent Crossings can also be studied alongside other technical tools.
Depending on your strategy, you may investigate:
- RSI
- MACD
- Moving averages
- SuperTrend
- Fibonacci
- Volume-based indicators
- Support and resistance
- Trend indicators
- Market structure tools
- Momentum indicators
But don't fall into the trap of putting 15 indicators on one chart.
More indicators don't automatically mean better analysis.
Instead, look for indicators that answer different questions.
For example:
Trend indicator: What direction is the market moving?
Momentum indicator: How strong is the move?
Support/resistance: Where is price?
Ghost Tangent Crossings: Is the indicator relationship changing?
Price action: Is the market confirming the idea?
That's confluence.
How To Backtest Ghost Tangent Crossings
Before risking real money, test the indicator.
Choose a Forex pair and historical timeframe.
Then record every qualifying setup.
Track:
- Currency pair
- Timeframe
- Market direction
- Crossing direction
- Support/resistance location
- Entry
- Stop-loss
- Target
- Risk-to-reward ratio
- Result
- Maximum adverse movement
- Maximum favorable movement
- Market conditions
After collecting enough trades, look for patterns.
You may discover that the indicator performs differently during:
- Strong trends
- Ranges
- High volatility
- Low volatility
- London sessions
- New York sessions
- Major economic announcements
Your data should determine your rules—not your emotions.
Ghost Tangent Crossings Indicator: Final Trading Checklist
Before taking a trade, ask:
Market Direction
Is the overall market bullish, bearish, or ranging?
Market Structure
What are the current highs and lows telling me?
Location
Is price near meaningful support or resistance?
Price Action
Is price confirming the trade idea?
Ghost Tangent Crossing
Is the indicator supporting the direction?
Confluence
Do multiple factors agree?
Risk
Where is the trade invalidated?
Reward
Is the potential reward worth the risk?
Position Size
Am I risking an amount consistent with my trading plan?
Discipline
Would I still take this trade if I couldn't watch the position afterward?
If you cannot answer these questions, the setup may not be ready.
Take Your Forex Trading Beyond One Indicator
Learning how to use a TradingView indicator is useful.
Learning how to build a complete Forex trading process around multiple forms of evidence is far more valuable.
The Ghost Tangent Crossings Indicator can become one component of that process.
But your edge comes from the complete system:
Market Structure
→ Trend
→ Key Levels
→ Price Action
→ Indicator Confirmation
→ Risk Management
→ Execution
→ Review
That's how individual indicators become part of a real trading methodology.
Ready To Build Higher-Probability Forex Setups?
If you're tired of jumping from one indicator to another looking for the "perfect" signal, it's time to change the approach.
Learn how to combine candlestick patterns, trend shifts, market structure, technical confirmation, and disciplined risk management into repeatable Forex setups.
Start Here:
FREE Forex Trading Starter Kit
Learn the foundations every Forex trader needs before risking real capital.
FREE High-Probability Japanese Candlestick Patterns Guide
Discover powerful candlestick formations and learn how traders use them to analyze potential market reversals and continuations.
High-Probability Forex Setups Course
Because protecting trading capital is just as important as finding the next opportunity.
Explore More Forex Trading Resources
Keep building your trading knowledge with more Forex Trading Unlocked resources:
Forex Trading
Build your understanding of the world's largest financial market.
Japanese Candlestick Patterns
Master one of the most important visual languages of price action.
High-Probability Japanese Candlestick Patterns Every Trader Must Know
Get the free guide and put powerful candlestick formations into your trading toolbox.
The Ultimate Chart Patterns Forex Trading Course
Learn how chart structures can help identify potential continuation and reversal opportunities.
Forex Trading Unlocked Blog
Continue learning with new Forex trading education, strategies, indicators, and market analysis.
Final Thought
The Ghost Tangent Crossings Indicator is not a magic button for finding winning trades.
And that's exactly why you should approach it differently.
Don't ask the indicator to make the decision for you.
Use it to help you ask better questions.
Where is the market going?
Where is price?
What is the trend?
What is the structure?
Is price confirming the move?
Does the crossing support the thesis?
Where am I wrong?
How much am I willing to lose?
When you can answer those questions before you enter a trade, you're no longer simply trading an indicator. You're building a trading process.
That's the difference between chasing signals and becoming a disciplined Forex trader.
👉 “Get Instant Access (Check Your Email)”
💥 IMPORTANT: One Last Step Required
After you enter your email, check your inbox (or spam folder) for a confirmation email.
👉 Click the confirmation link so I can send you your free Forex training.
⚠️ If you don’t confirm, I can’t send you anything.
👉 “⚠️ Access expires if not confirmed within 24 hours minutes.”
👉 “Takes 10 seconds. Instant access after email confirmation.”