How To Use The ADX Lifecycle Trail Indicator On TradingView In Forex Trading
Discover Forex Trend Strength, Identify Market Momentum, and Find Potential Trading Opportunities
Successful Forex trading is not about guessing where the market will move next. It is about learning to recognize market conditions, identifying potential trading opportunities, and managing risk before entering a position.
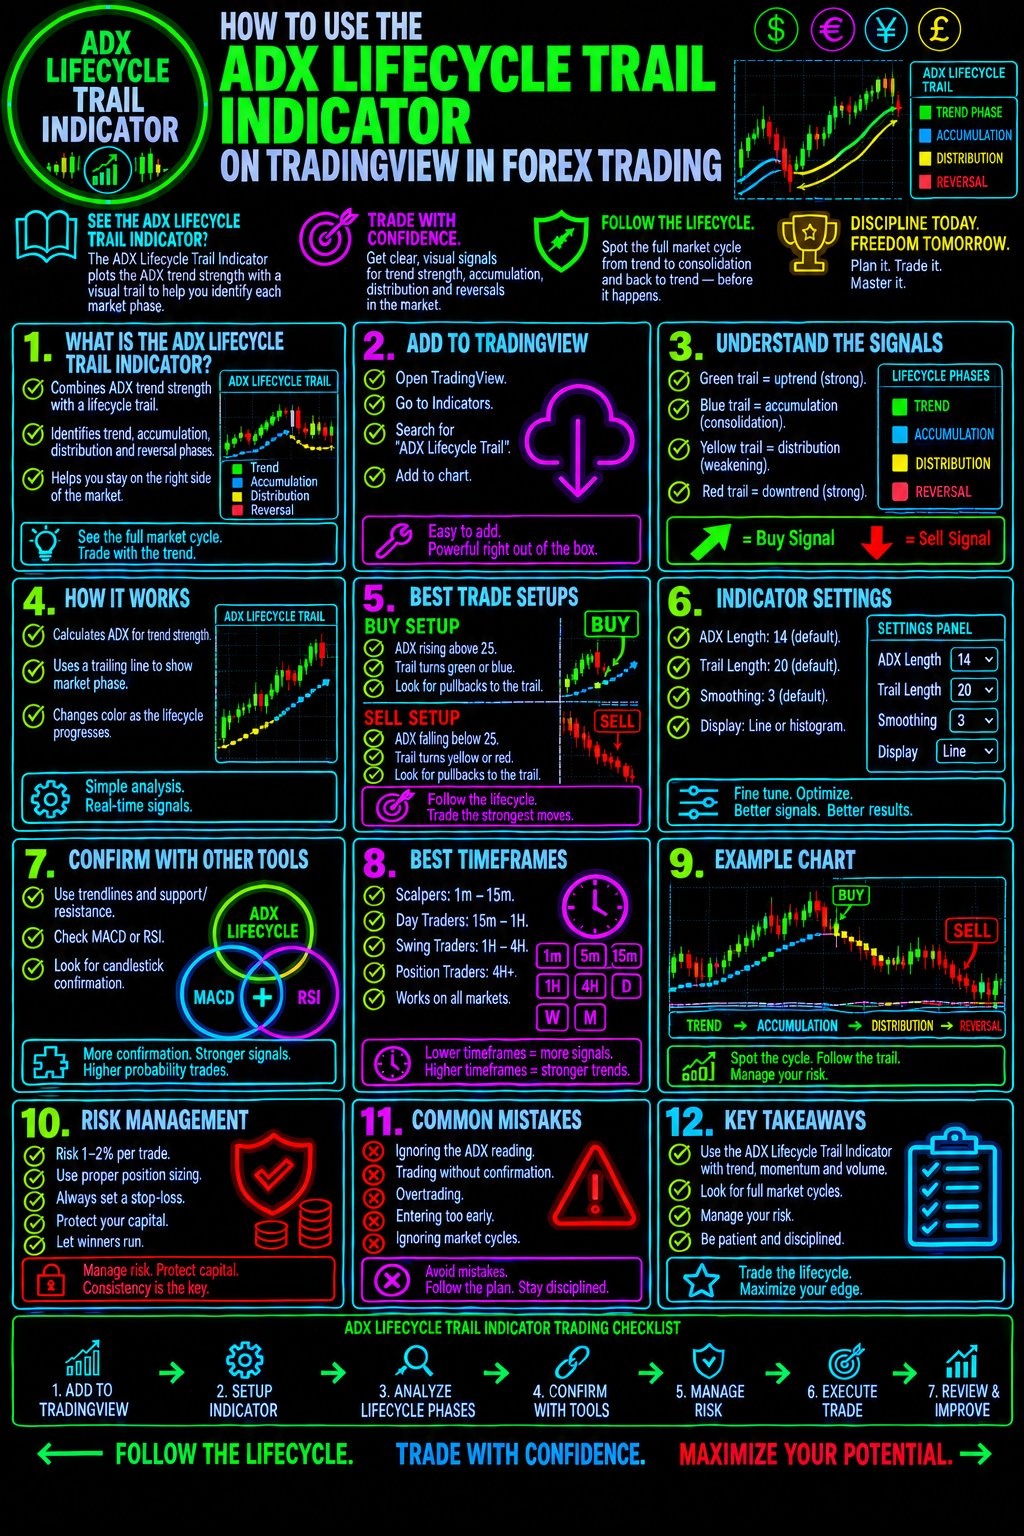
The ADX Lifecycle Trail Indicator on TradingView can help traders analyze trend strength, follow changing market conditions, and evaluate potential entry and exit opportunities. When combined with price action, Japanese candlestick patterns, support and resistance, and disciplined risk management, this indicator can become a valuable part of a structured Forex trading strategy.
Whether you trade EUR/USD, GBP/USD, USD/JPY, or other currency pairs, understanding how to interpret trend strength and changing market conditions can help you make more informed trading decisions.
Want to improve your Forex trading skills? Forex Trading Unlocked provides educational resources, trading strategies, technical analysis lessons, and practical tools to help you develop a more disciplined approach to the currency markets.
What Is The ADX Lifecycle Trail Indicator?
The ADX Lifecycle Trail Indicator is a TradingView charting tool designed to help traders evaluate market trends and follow changes in price behavior.
Its name combines two important concepts in technical analysis:
- ADX: The Average Directional Index, a technical indicator developed to measure the strength of a trend.
- Lifecycle Trail: A trailing visual reference that may help traders follow price movement and assess how a trend develops or changes.
The exact features, colors, signals, and calculations of an ADX Lifecycle Trail script depend on its individual implementation by the TradingView author. Traders should consult the script's description and settings to confirm how its signals are generated.
The underlying principle is important: a market trend can strengthen, weaken, continue, or reverse. Recognizing these changing conditions may help traders avoid entering positions without sufficient confirmation.
However, no indicator can predict every market movement or guarantee profitable trades.
What Is The Average Directional Index (ADX)?
The Average Directional Index measures the strength of a trend without independently identifying whether that trend is bullish or bearish.
The traditional ADX is calculated using smoothed directional movement values, commonly referred to as +DI and -DI.
- +DI (Positive Directional Indicator): Measures positive directional movement.
- -DI (Negative Directional Indicator): Measures negative directional movement.
- ADX: Measures the strength of the prevailing directional movement.
A commonly used interpretation of ADX readings is:
ADX Reading General Interpretation
Below 20 Often associated with weak or limited trend strength
20–25 May indicate a developing trend
Above 25 Often associated with stronger trending conditions
Above 40 May indicate a particularly strong trend
These levels are guidelines, not universal rules. Market conditions, currency pairs, timeframes, and indicator settings can affect how useful they are.
Important: A rising ADX generally suggests increasing trend strength, while a falling ADX suggests decreasing trend strength. Neither movement guarantees that price will continue in the same direction.
What Does The Lifecycle Trail Add To Forex Analysis?
The trailing component of an indicator may provide a visual reference for following price movement and evaluating potential changes in market direction.
Depending on the particular TradingView script, its trail may be based on price, volatility, directional movement, or other calculations. Do not assume that every ADX Lifecycle Trail script uses the same methodology.
When the indicator is applied to a Forex chart, traders can evaluate several questions:
- Is price moving in a recognizable direction?
- Is the current trend gaining or losing strength?
- Is price holding above or below the indicator's trail?
- Is a potential trend change supported by price action?
- Does the trade offer a reasonable reward relative to the risk?
These questions help turn an indicator from a simple chart signal into part of a more complete trading decision.
How To Add The ADX Lifecycle Trail Indicator To TradingView
TradingView makes it possible to apply technical indicators directly to currency charts.
Follow these steps to locate and evaluate the indicator.
Step 1: Open TradingView
Visit TradingView and open a Forex chart.
Choose a currency pair you want to analyze, such as EURUSD, GBPUSD, or USDJPY.
Start with a pair you understand and can monitor consistently.
Step 2: Open The Indicators Menu
Select the Indicators option above the chart.
Use the search function to look for:
ADX Lifecycle Trail
Check the available results carefully. TradingView may contain community-created scripts with similar names or variations.
Step 3: Verify The Correct Script
Before applying an indicator, review its description, author information, and available documentation.
Confirm that the script is the intended ADX Lifecycle Trail indicator rather than another tool with a similar name.
If the script is unavailable publicly, you may need its direct TradingView link or access provided by its author.
Step 4: Add The Indicator To Your Chart
Select the appropriate script and apply it to your chart.
Observe how the indicator appears alongside price. Depending on the implementation, it may display a trailing line, changing colors, directional signals, or additional trend-strength information.
Do not assume that a particular color represents a buy or sell signal until you have confirmed the author's explanation.
Step 5: Review The Indicator Settings
Open the indicator's settings and review the available inputs.
Depending on the script, these may include lookback periods, smoothing parameters, sensitivity settings, or display options.
Changing these values can affect how quickly the indicator responds to price changes.
Test settings on historical charts and in a demo environment before considering live trading.
How To Use The ADX Lifecycle Trail Indicator In Forex Trading
1. Identify The Prevailing Market Direction
Begin by examining price action before acting on the indicator.
In a potential bullish trend, look for higher highs and higher lows. In a potential bearish trend, look for lower highs and lower lows.
Then evaluate the position and behavior of the indicator's trail, using the rules documented for that specific script.
A bullish-looking trail is not enough by itself to justify a long position. Likewise, a bearish-looking trail should not automatically trigger a short position.
The objective is alignment between the indicator and the actual price structure.
For more guidance, study the principles in our Forex Trading Strategies and Technical Analysis Resources.
2. Evaluate Trend Strength With ADX
Once you have identified a possible direction, consider whether the market is trending strongly enough to support a trend-following trade.
A rising ADX may suggest that directional movement is becoming stronger. A low or declining ADX may indicate that the market is consolidating or that an existing trend is losing strength.
For example, suppose EURUSD begins forming higher highs and higher lows while ADX rises above a level you have chosen as part of your trading rules.
This combination may justify looking for a potential bullish entry.
It does not guarantee that the next move will be higher. Always evaluate the entry location, nearby resistance, stop-loss placement, and potential reward.
3. Wait For Price Action Confirmation
One of the most common Forex trading mistakes is entering a position immediately after an indicator changes.
A more disciplined approach is to wait for price action to confirm the opportunity.
Look for evidence such as:
- A bullish or bearish candlestick pattern near an important price level.
- A breakout from a well-defined consolidation range.
- A successful break-and-retest of support or resistance.
- A continuation pattern that agrees with the prevailing trend.
- A clear market-structure shift that supports the proposed trade.
For example, if EUR/USD is in an established bullish trend and pulls back toward former resistance that has become support, a bullish rejection candle may provide additional evidence for a potential continuation trade.
The ADX Lifecycle Trail can contribute to the analysis, but the decision should be based on your complete set of trading rules.
Explore our High Probability Japanese Candlestick Patterns to learn how candlestick formations can help you evaluate price behavior.
4. Look For Potential Long Entries
A potential long setup may develop when:
- Price structure supports a bullish bias.
- The indicator's behavior agrees with the documented bullish conditions for the script.
- Trend-strength analysis supports a directional move.
- Price pulls back to a potentially meaningful support level or breaks out of a valid trading range.
- A bullish price-action signal provides additional confirmation.
- The trade offers an acceptable risk-to-reward ratio.
A trader might enter after a confirmed breakout or after a pullback and bullish rejection, depending on the strategy being tested.
The entry trigger should be defined before placing the trade. Avoid chasing a move simply because price has already advanced substantially.
5. Look For Potential Short Entries
The same process applies in reverse when evaluating a bearish setup.
A potential short trade may be worth investigating when:
- Price forms lower highs and lower lows.
- The indicator agrees with the script's documented bearish conditions.
- ADX suggests sufficient trend strength for the strategy.
- Price rallies toward resistance or breaks below a defined support level.
- Bearish price action supports the proposed entry.
- The potential reward justifies the risk.
For example, a bearish rejection candle near resistance during an established downtrend may provide a more structured trading opportunity than selling simply because an indicator has changed color.
No single confirmation eliminates the possibility of a losing trade.
6. Use The Trail To Help Manage An Open Position
If the indicator provides a trailing reference, it may help you evaluate whether to maintain a position or consider adjusting your stop-loss.
However, first establish how the trail is calculated and whether it updates with each candle.
A possible management plan could include:
- Placing the initial stop-loss beyond a meaningful technical invalidation point.
- Evaluating whether the trail remains consistent with the trade's direction.
- Moving a stop only according to predetermined rules.
- Considering a partial profit or exit when price reaches a planned target.
- Exiting when the original trade thesis is invalidated.
Do not automatically move your stop-loss on every minor change in an indicator. An excessively tight stop can close a position during normal market fluctuations, while a stop placed too far away can create unnecessary risk.
The goal is to manage risk systematically rather than react emotionally to every price movement.
A Practical ADX Lifecycle Trail Trading Example
Consider a hypothetical EURUSD setup on the one-hour chart.
The example illustrates a decision-making process rather than a verified signal from a particular TradingView script.
Market conditions: EURUSD is forming higher highs and higher lows.
Trend-strength analysis: ADX is rising, suggesting that directional movement is strengthening.
Price-action confirmation: Price pulls back toward a previous resistance level that may now act as support. A bullish rejection candle forms near that area.
Indicator confirmation: The ADX Lifecycle Trail behaves in accordance with the bullish conditions defined by its author.
Entry plan: The trader waits for the predefined confirmation trigger rather than entering solely because price touches the trail.
Stop-loss: The stop is placed at a technically justified level where the bullish setup would be invalidated.
Profit target: The trader identifies a potential target using the next resistance zone or a predefined reward-to-risk objective.
Before entering, the trader calculates the potential loss and verifies that the position size fits the account's risk limits.
If the conditions do not align, the trader skips the setup.
That last step matters. Professional trading is not about finding a reason to enter every market. It is about waiting for opportunities that meet your criteria.
How To Combine The ADX Lifecycle Trail With Other Forex Indicators
No technical indicator provides a complete picture of the Forex market. Combining complementary tools can help you evaluate trend direction, price location, and trade timing.
The key is to use each tool for a distinct purpose rather than adding indicators that repeat the same information.
ADX Lifecycle Trail + Support And Resistance
Support and resistance help identify areas where price may encounter buying or selling pressure.
The ADX Lifecycle Trail can contribute information about trend conditions, while support and resistance provide context for potential entry locations.
A strong trend does not make every entry attractive. Buying immediately below major resistance or selling directly above significant support may create an unfavorable risk-to-reward profile.
Study our Forex Trading Technical Analysis Resources to strengthen your understanding of chart structure.
ADX Lifecycle Trail + Japanese Candlestick Patterns
Candlestick patterns help traders evaluate the interaction between buyers and sellers at specific price levels.
Examples include:
- Bullish and bearish engulfing patterns.
- Hammer and shooting star formations.
- Morning star and evening star patterns.
- Rejection candles near support or resistance.
A candlestick pattern is more meaningful when it appears in a relevant market location and agrees with a clearly defined trading plan.
Learn how to recognize these formations in our High Probable Japanese Candlestick Patterns Guide.
ADX Lifecycle Trail + Moving Averages
Moving averages can help traders assess the broader trend and smooth short-term price fluctuations.
For example, a trader may use a longer-period moving average to establish a directional bias and then look for a pullback entry using price action and the ADX Lifecycle Trail.
Moving averages lag price, however, and may produce misleading signals during sideways markets.
ADX Lifecycle Trail + RSI
The Relative Strength Index (RSI) measures the speed and magnitude of recent price changes.
RSI may help evaluate momentum and identify conditions commonly associated with overbought or oversold readings.
Remember that overbought conditions do not automatically mean a market must fall, and oversold conditions do not automatically mean it must rise.
Using RSI alongside trend analysis may help provide additional context, but it should not replace a complete trading plan.
ADX Lifecycle Trail + MACD
The Moving Average Convergence Divergence (MACD) indicator can help traders evaluate momentum and changes in the relationship between moving averages.
A trader might compare MACD behavior with the prevailing price structure and the ADX Lifecycle Trail to determine whether the evidence supports a potential continuation setup.
Avoid treating several indicators as independent confirmation when they are responding to similar underlying price movements.
Which Forex Timeframe Works Best?
The best timeframe depends on your trading style, available time, risk tolerance, and the behavior of the currency pair.
Trading Style Possible Timeframes Main Consideration
Scalping 1-minute to 5-minute Rapid signals and greater sensitivity to spread and execution costs
Day trading 5-minute to 1-hour Intraday trend development and session volatility
Swing trading 4-hour to daily Larger price structures and wider stop-loss requirements
Position trading Daily to weekly Longer-term market conditions and broader economic influences
These are common examples, not universal recommendations.
Lower timeframes can generate more frequent signals and more noise. Higher timeframes may produce fewer signals but require patience and the ability to tolerate larger price fluctuations.
A useful approach is to identify the broader market structure on a higher timeframe and then evaluate potential entries on a lower timeframe, provided this multi-timeframe method has been tested.
Do not assume that a setting or timeframe that works on one currency pair will work equally well on another.
Common ADX Lifecycle Trail Trading Mistakes To Avoid
Even a well-designed indicator can be misused. Understanding common mistakes can help you develop a more consistent trading process.
Mistake 1: Treating Every Signal As A Buy Or Sell Command
Indicator signals are evidence to evaluate, not instructions to follow blindly.
Wait for the conditions defined in your strategy and confirm that the potential trade has a logical entry, stop-loss, and profit target.
Mistake 2: Ignoring Sideways Markets
Trend-following strategies can struggle when price moves within a narrow range.
ADX may help identify limited trend strength, but it cannot eliminate false breakouts or reliably predict when a new trend will begin.
When conditions do not meet your rules, staying out of the market is a legitimate trading decision.
Mistake 3: Entering After The Move Has Already Happened
A signal that appears after a substantial price move may offer an unattractive entry.
Evaluate the distance to nearby support or resistance, the location of the stop-loss, and the remaining potential reward before committing capital.
Mistake 4: Changing Settings Until Historical Results Look Perfect
Repeatedly adjusting indicator parameters to fit past market movements can produce misleading backtest results.
This is a form of overfitting. A configuration that looks excellent on historical data may perform poorly in new market conditions.
Define your testing process in advance and evaluate the strategy on data that was not used to select the settings.
Mistake 5: Neglecting Risk Management
Even a strategy with a sound analytical foundation can lose money.
Determine the maximum acceptable loss before entering a position. Use a stop-loss where appropriate, calculate position size carefully, and avoid risking money you cannot afford to lose.
For additional guidance, explore our Forex trading education resources at Forex Trading Unlocked.
How To Test The ADX Lifecycle Trail Indicator Before Trading Live
Before risking real money, determine whether the indicator adds value to a repeatable trading strategy.
Use a structured testing process.
Step 1: Define your trading rules.
Write down the entry conditions, exit conditions, stop-loss method, profit-target rules, timeframe, and circumstances in which you will not trade.
Step 2: Select the currency pairs and market conditions.
Test more than one period of market history where practical. Include trending and ranging conditions rather than selecting only favorable examples.
Step 3: Record every qualifying setup.
Track the entry, exit, maximum adverse movement, maximum favorable movement, transaction costs, and reason for taking the trade.
Step 4: Measure the results.
Evaluate win rate, average winning trade, average losing trade, maximum drawdown, and expectancy after costs.
A strategy can have a modest win rate and still be profitable if its average wins sufficiently exceed its average losses. Conversely, a high win rate does not guarantee profitability if occasional losses are very large.
Step 5: Test on unseen data.
Evaluate the rules on historical periods that were not used to develop or optimize the strategy.
Step 6: Use a demo account.
Practice applying the rules under realistic conditions before considering live capital.
Be alert to repainting, delayed signals, and historical signals that appear differently in real time. Confirm whether the particular script recalculates past values or depends on information unavailable at the time of entry.
Past performance does not guarantee future results.
Can The ADX Lifecycle Trail Indicator Predict Forex Reversals?
No indicator can reliably predict every Forex reversal.
The ADX measures trend strength rather than direction, and a change in a trailing indicator may occur after price has already begun moving.
A potential reversal is more credible when several elements agree, such as:
- A meaningful break in market structure.
- A rejection or reversal pattern near an important price level.
- A loss of momentum in the prior direction.
- A confirmed change in the indicator's behavior.
- A clearly defined invalidation point for the trade.
Even when these factors align, the market may resume its original direction.
It is often more productive to think in terms of probabilities and risk management than to search for a perfect reversal signal.
Is The ADX Lifecycle Trail Indicator Suitable For Beginners?
Beginners can use the indicator as a learning tool, provided they understand its limitations and first establish a foundation in technical analysis.
Start by learning how to identify trends, support and resistance, candlestick formations, and appropriate position sizes.
Then examine the indicator on historical charts and observe how it behaves during strong trends, pullbacks, breakouts, and consolidations.
Avoid using real money simply because a signal looks convincing.
A beginner's objective should be to learn a repeatable process, preserve capital, and understand why a trade qualifies under predefined rules.
Build A More Complete Forex Trading Strategy With Forex Trading Unlocked
Learning to use the ADX Lifecycle Trail Indicator is one step toward becoming a more informed trader. The next step is combining technical analysis with risk management, market structure, and a consistent trading process.
At Forex Trading Unlocked, our mission is to help traders develop the knowledge and discipline needed to approach the Forex market with greater confidence.
Explore our educational resources to continue building your skills.
Start With These Forex Trading Resources
1. Learn The Foundations Of Forex Trading
Understand currency pairs, pips, spreads, leverage, order types, and the mechanics of the foreign exchange market.
Visit Forex Trading Unlocked to continue your technical analysis and Forex education.
2. Master High-Probability Japanese Candlestick Patterns
Learn to recognize price-action formations and understand how their location within the market can influence their usefulness.
Explore our High Probable Japanese Candlestick Patterns educational resource.
3. Explore TradingView Chart Analysis
Develop a more structured charting process by studying indicators, market trends, price action, and potential trading setups.
Use the ADX Lifecycle Trail as one component of your analysis rather than relying on any single indicator.
4. Develop A Disciplined Trading Process
Focus on risk management, trade planning, and consistent execution. A strategy is only useful when you can apply its rules and evaluate its results objectively.
Your next step: Choose one currency pair, apply the ADX Lifecycle Trail Indicator if the correct script is available, and begin documenting potential setups on historical charts. Build evidence before committing capital.
Frequently Asked Questions About The ADX Lifecycle Trail Indicator
What Is The ADX Lifecycle Trail Indicator Used For?
It is a TradingView indicator intended to help traders assess trend-related conditions and follow price movement. Its exact signals and functionality depend on the specific script implementation.
Does The ADX Lifecycle Trail Indicator Work On TradingView?
If the relevant script is available and compatible with your TradingView chart, you can apply it through the Indicators menu. Availability, access requirements, and settings depend on the script's author.
Does ADX Show Whether A Forex Trend Is Bullish Or Bearish?
No. The Average Directional Index measures trend strength, not direction by itself. The +DI and -DI components and actual price action can help traders assess directional bias.
What Is A Good ADX Level For Forex Trading?
Many traders use readings around 20–25 as reference points when evaluating trend strength. These levels are not guaranteed entry signals and should be tested within a complete strategy.
Can I Use The ADX Lifecycle Trail Indicator For Scalping?
Potentially, if the particular script supports your chosen chart timeframe and its behavior has been adequately tested. Scalping is sensitive to spreads, execution costs, slippage, and rapid market fluctuations.
Can I Combine The ADX Lifecycle Trail With Candlestick Patterns?
Yes. Candlestick patterns can help traders evaluate price behavior near support, resistance, and other significant levels. Their usefulness depends on market context and the quality of the trading rules.
Does The ADX Lifecycle Trail Indicator Guarantee Profitable Forex Trades?
No. All trading strategies can experience losses, and indicators may generate false or delayed signals. Risk management and testing remain essential.
Final Thoughts: Use The ADX Lifecycle Trail Indicator As Part Of A Trading Plan
The ADX Lifecycle Trail Indicator can provide another perspective on Forex trends and potential trading opportunities. Its real usefulness depends on the exact script, the market conditions, and how it fits within a tested strategy.
Focus on three priorities:
- Identify the market structure before deciding whether to look for a long or short position.
- Confirm potential setups with appropriate price action and trend analysis.
- Protect your capital through disciplined position sizing, stop-loss planning, and objective testing.
Do not chase every signal. Wait for opportunities that meet your trading rules, record your results, and improve your process over time.
Continue your Forex trading education with Forex Trading Unlocked and build the analytical skills needed to approach the currency markets with a more disciplined, informed, and risk-conscious mindset.
Risk Disclaimer: Forex and leveraged trading involve substantial risk and may not be suitable for every investor. You can lose some or all of your invested capital. Technical indicators are analytical tools, not guarantees of future results. Always conduct your own research and assess your financial circumstances before trading.
👉 “Get Instant Access (Check Your Email)”
💥 IMPORTANT: One Last Step Required
After you enter your email, check your inbox (or spam folder) for a confirmation email.
👉 Click the confirmation link so I can send you your free Forex training.
⚠️ If you don’t confirm, I can’t send you anything.
👉 “⚠️ Access expires if not confirmed within 24 hours minutes.”
👉 “Takes 10 seconds. Instant access after email confirmation.”