How To Use The "Almazov Trade: MTF Structure & BOS Entries" Indicator On TradingView In Forex Trading
Master Forex Market Structure, Identify Breaks Of Structure, And Find Better Trade Entries
Successful forex trading isn't about taking every signal that appears on a chart. It's about understanding what the market is doing, recognizing when institutional-style market structure changes, and identifying opportunities where price action provides a logical reason to enter a trade.
The Almazov Trade MTF Structure And BOS Entries Indicator on TradingView is designed to help traders analyze multiple-timeframe market structure and identify Breaks of Structure (BOS) that may signal potential trading opportunities.
Instead of relying on guesswork, traders can use market structure, directional bias, and BOS entry signals to develop a more organized approach to forex trading.
In this guide, you'll learn how the Almazov Trade MTF Structure And BOS Entries Indicator works, how to interpret its signals, how to incorporate it into your forex trading strategy, and how to use additional technical analysis tools to improve your trading decisions.
If you want to become a more disciplined forex trader, understanding market structure is an essential step.
What Is The Almazov Trade MTF Structure And BOS Entries Indicator?
The Almazov Trade MTF Structure And BOS Entries Indicator is a TradingView technical analysis tool designed to help traders evaluate market structure across multiple timeframes and identify potential Break of Structure trading opportunities.
Let's break down the three important components.
1. MTF – Multiple Timeframe Analysis
MTF stands for Multiple Time Frame. It allows traders to evaluate market conditions across different chart timeframes rather than making trading decisions using only one chart.
For example:
- Daily chart: Identify the broader market direction.
- 4-hour chart: Evaluate intermediate market structure.
- 1-hour chart: Identify developing trading opportunities.
- 15-minute chart: Refine potential entry timing.
Understanding how different timeframes interact can help traders avoid entering positions against the broader market direction.
2. Market Structure
Market structure describes how price moves through a sequence of swing highs and swing lows.
In an uptrend, price generally establishes:
- Higher highs (HH).
- Higher lows (HL).
In a downtrend, price generally establishes:
- Lower highs (LH).
- Lower lows (LL).
Recognizing these formations helps traders understand whether buyers or sellers currently have control of the market.
3. BOS – Break Of Structure
A Break of Structure occurs when price breaks an important previous swing high or swing low.
A bullish BOS occurs when price breaks above a relevant previous swing high.
A bearish BOS occurs when price breaks below a relevant previous swing low.
These events can provide clues about directional momentum and potential continuation opportunities.
However, not every structure break produces a successful trade. Traders should evaluate confirmation, market conditions, and risk before entering a position.
Why Multiple Timeframe Market Structure Matters In Forex Trading
One of the biggest mistakes forex traders make is analyzing a single timeframe without understanding what is happening on the larger charts.
A currency pair might look bullish on a 15-minute chart while the 4-hour chart is still showing a strong bearish trend.
This creates conflicting information.
Multiple timeframe analysis helps traders put short-term price movements into a broader market context.
For example, consider EURUSD.
The daily chart may establish a bearish directional bias. The 4-hour chart may show lower highs and lower lows. Meanwhile, the 15-minute chart could produce a temporary bullish move.
A trader who only watches the 15-minute chart might interpret that move as a buying opportunity.
A trader who understands the larger market structure may recognize it as a potential retracement before another bearish continuation.
The objective is to understand the bigger picture before committing capital to a smaller-timeframe trading opportunity.
Related Forex Trading Guides:
- Forex Trading Strategies
- Forex Technical Analysis
- Support And Resistance In Forex Trading
- Understanding Forex Market Trends
How To Use The Almazov Trade MTF Structure And BOS Entries Indicator On TradingView
The key to using this indicator effectively is understanding how multiple-timeframe structure and Break of Structure signals can work together.
Here is a practical approach.Step 1: Add The Indicator To Your TradingView Chart
Open TradingView and select the forex currency pair you want to analyze.
Navigate to the Indicators section and search for:
Almazov Trade MTF Structure And BOS Entries
Select the indicator if it is available to your TradingView account.
Once loaded, examine the chart and familiarize yourself with the indicator's displayed market structure information and BOS entry markings.
The exact visual elements and available settings may depend on the indicator version.
Step 2: Establish The Higher-Timeframe Market Direction
Before looking for an entry, determine the broader market direction.
Start with the daily or 4-hour chart.
Look for:
- Higher highs and higher lows indicating bullish structure.
- Lower highs and lower lows indicating bearish structure.
- Important swing highs and swing lows.
- Potential changes in market direction.
- Areas where price is approaching significant support or resistance.
Your objective is to establish a directional bias.
Avoid assuming that every bullish or bearish signal represents a complete trend reversal.
Step 3: Identify Breaks Of Structure
Next, examine the BOS information displayed by the indicator.
A bullish Break of Structure may indicate that buyers have pushed price above a previous structural high.
A bearish Break of Structure may indicate that sellers have pushed price below a previous structural low.
Pay attention to the location of the break.
A structure break occurring in the direction of the higher-timeframe trend may offer a more attractive trading context than a break occurring directly against it.
Also examine whether the break is supported by a meaningful candle close rather than simply a temporary wick beyond the previous level.
Step 4: Look For Entry Opportunities On A Lower Timeframe
Once you have established the broader market direction, move down to a lower timeframe.
For example:
- Daily chart: Overall directional bias.
- 4-hour chart: Market structure confirmation.
- 1-hour chart: Developing BOS opportunity.
- 15-minute chart: Potential entry refinement.
Look for a lower-timeframe structure break that agrees with the larger directional bias.
You can also examine whether price pulls back toward the broken structure level before continuing.
This can help traders avoid chasing price after an extended move.
Step 5: Establish Your Stop Loss And Take Profit
Never enter a forex trade simply because an indicator displays an entry signal.
You need a defined risk management plan.
For a potential bullish trade:
- Identify the structural level supporting the trade.
- Consider placing the stop loss below the relevant swing low.
- Identify the next resistance area.
- Calculate the potential reward relative to the amount being risked.
For a potential bearish trade:
- Identify the structural level supporting the short position.
- Consider placing the stop loss above the relevant swing high.
- Identify the next support area.
- Calculate the potential reward relative to the amount being risked.
Your stop loss should account for normal market volatility and the structure of the currency pair.
Remember: A good trading setup without proper risk management can still become a bad trade.
Bullish BOS Trading Strategy Using The Almazov Trade Indicator
BULLISH MARKET SETUP
A bullish Break of Structure strategy looks for evidence that buyers are gaining control of the market.
Here is a potential trading sequence:
- Identify bullish market structure on the higher timeframe.
- Look for a sequence of higher highs and higher lows.
- Wait for a bullish BOS signal on the trading timeframe.
- Watch for a potential retracement toward the broken structural level.
- Look for bullish price action confirmation.
- Establish your stop loss below the relevant structural low.
- Identify a logical profit target using resistance or the next structural high.
The advantage of this approach is that you're looking to participate in a developing bullish trend rather than attempting to predict every market reversal.
Example: EURUSD Bullish Setup
Imagine EURUSD is trading in an established 4-hour uptrend.
Price establishes a higher high, pulls back, and then breaks above its previous swing high.
The indicator identifies a bullish BOS opportunity.
Instead of immediately chasing the breakout, you wait for price to retrace toward the broken level.
If bullish price action develops, you can evaluate a potential long entry.
The trade is only considered if the potential reward justifies the risk.
Bearish BOS Trading Strategy Using The Almazov Trade Indicator
BEARISH MARKET SETUP
A bearish Break of Structure strategy looks for evidence that sellers are gaining control.
A potential bearish trading sequence:
- Identify bearish market structure on the higher timeframe.
- Look for lower highs and lower lows.
- Wait for a bearish BOS signal.
- Watch for a potential retracement toward the broken structural level.
- Look for bearish price action confirmation.
- Establish your stop loss above the relevant structural high.
- Identify a logical profit target near the next support area.
Example: GBPUSD Bearish Setup
Suppose GBPUSD is showing a bearish 4-hour structure.
Price establishes a lower low and subsequently retraces upward.
The market then breaks below an important previous swing low, producing a bearish BOS.
Rather than selling after an extended downward move, you wait to see whether price retraces toward the broken structure.
If sellers regain control, the setup may offer an opportunity to enter in the direction of the broader trend.
As always, confirm the trade's risk-to-reward potential before committing capital.
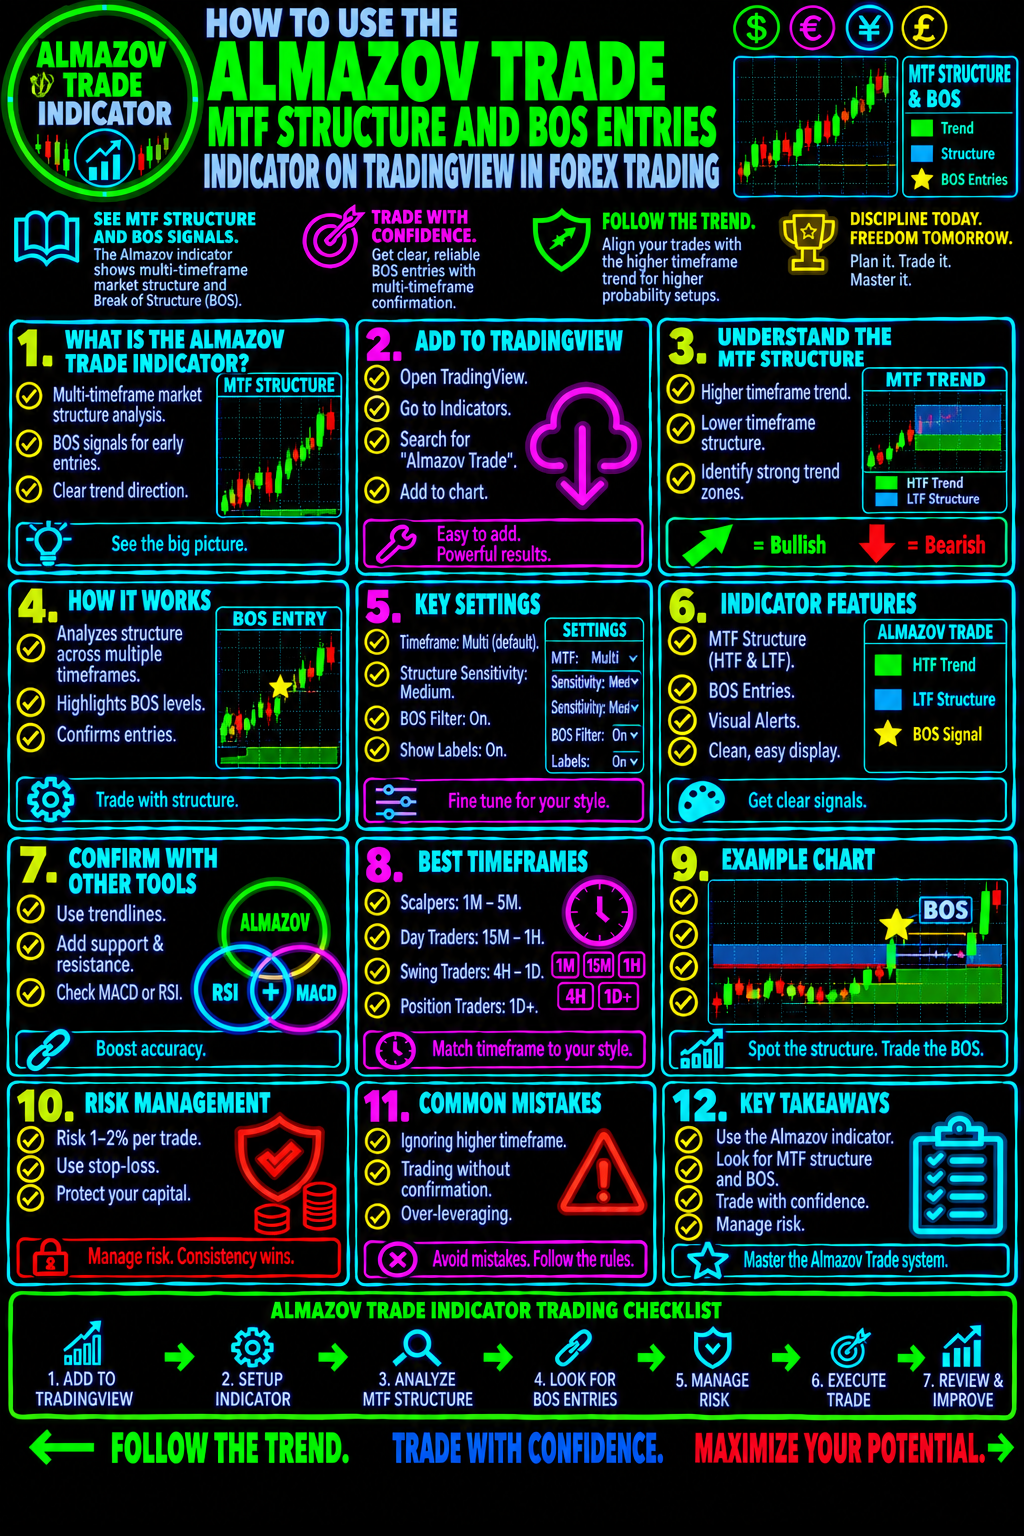
How To Combine The Almazov Trade Indicator With Other Technical Indicators
One indicator should never be expected to do everything.
The Almazov Trade MTF Structure And BOS Entries Indicator can be used as part of a broader technical analysis system.
Combining market structure with additional confirmation tools may help traders evaluate whether a potential setup deserves further consideration.
Here are several tools worth exploring.
1. Moving Averages
Moving averages help traders evaluate directional momentum and the broader trend.
For example:
- Price above the 200 EMA may support a bullish market bias.
- Price below the 200 EMA may support a bearish market bias.
- The 50 EMA can help evaluate intermediate trend conditions.
A bullish BOS occurring above a rising 200 EMA may provide additional trend context.
Explore: Moving Averages In Forex Trading
2. RSI – Relative Strength Index
The RSI measures the speed and magnitude of recent price movements.
It can help traders evaluate momentum, overbought and oversold conditions, and potential divergence.
For example, a bullish BOS accompanied by improving RSI momentum may provide additional confirmation.
Explore: How To Use RSI In Forex Trading
3. MACD – Moving Average Convergence Divergence
MACD helps traders evaluate momentum and potential changes in directional strength.
A bullish BOS accompanied by improving MACD momentum may strengthen the technical case for a potential long setup.
A bearish BOS accompanied by weakening momentum may help traders evaluate a potential short opportunity.
Explore: How To Use MACD In Forex Trading
4. Fibonacci Retracement
Fibonacci retracement levels can help traders identify potential pullback areas within an existing trend.
Commonly watched levels include:
- 38.2%.
- 50%.
- 61.8%.
A retracement toward a Fibonacci level that also coincides with a previous BOS level may provide an interesting area for further price action analysis.
Explore: How To Use Fibonacci In Forex Trading
Almazov Trade MTF Structure And BOS Entries: Common Trading Mistakes To Avoid
Even a useful technical indicator can produce disappointing results when traders misuse its information.
Here are some common mistakes to avoid.
1. Trading Every BOS Signal
Not every break of structure leads to a sustained trend continuation.
Evaluate the larger market environment before entering.
2. Ignoring Higher Timeframes
A lower-timeframe bullish BOS may occur during a much larger bearish trend.
Always understand the broader market context.
3. Chasing Breakouts
Entering after price has already traveled a considerable distance can produce unfavorable risk-to-reward conditions.
Consider waiting for a pullback and additional confirmation.
4. Ignoring Economic News
Forex markets can experience significant volatility during central bank announcements, inflation releases, employment reports, and other major economic events.
Always be aware of the economic calendar.
Explore: Forex Fundamental Analysis
5. Trading Without Risk Management
Never allow an indicator signal to determine how much capital you risk.
Develop a consistent risk management strategy before entering the market.
Explore: Forex Risk Management Strategies
How To Improve Your Forex Trading With Market Structure And BOS Analysis
If you want to become a consistently disciplined forex trader, you need more than a collection of indicators.
You need a repeatable trading process.
The Almazov Trade MTF Structure And BOS Entries Indicator can become one component of that process.
Consider building your trading routine around these principles:
- Establish higher-timeframe directional bias.
- Identify important structural highs and lows.
- Evaluate bullish and bearish BOS signals.
- Wait for favorable entry conditions.
- Confirm trades using additional technical analysis.
- Calculate stop loss and take profit levels.
- Maintain consistent risk management.
- Record your trades and evaluate performance.
The objective is not to trade more frequently.
The objective is to become more selective about the opportunities you take.
Build Your Forex Trading Knowledge With Forex Trading Unlocked
Understanding market structure, identifying Breaks of Structure, and recognizing high-probability trading opportunities are important skills for developing a more structured approach to forex trading.
But why stop here?
Forex Trading Unlocked provides educational resources designed to help traders understand technical analysis, trading strategies, candlestick patterns, indicators, risk management, and market behavior.
Explore these additional resources:
Improve Your Technical Analysis
Develop Better Trading Strategies
Take Your Trading Education Further
- Forex Trading Starter Kit
- High Probability Japanese Candlestick Patterns Every Trader Must Know
- The Ultimate Chart Patterns Forex Trading Course
- Forex Trading Unlocked
Get Started With The Almazov Trade MTF Structure And BOS Entries Indicator
The forex market is constantly moving. Trends develop, market structure changes, and trading opportunities appear across multiple timeframes.
Learning to recognize these changes can help you make more informed trading decisions.
The Almazov Trade MTF Structure And BOS Entries Indicator provides a framework for examining multiple-timeframe market structure and identifying potential Break of Structure opportunities.
Combine that information with disciplined technical analysis, confirmation, and proper risk management.
Don't just follow price. Learn to understand the structure behind it.
Start developing your trading knowledge today with Forex Trading Unlocked.
Frequently Asked Questions About The Almazov Trade MTF Structure And BOS Entries Indicator
What Does MTF Mean In Forex Trading?
MTF means Multiple Time Frame analysis. It involves examining a currency pair across different chart timeframes to understand broader market direction and identify potential trading opportunities.
What Does BOS Mean In Forex Trading?
BOS stands for Break of Structure. It occurs when price breaks an important previous swing high or swing low. Traders use these breaks to evaluate potential trend continuation or changes in market structure.
Is The Almazov Trade MTF Structure And BOS Entries Indicator Suitable For Beginners?
Beginners can use it as an educational tool for learning multiple-timeframe analysis and market structure. However, understanding swing highs, swing lows, trend direction, and risk management is important before trading its signals.
Can The Almazov Trade Indicator Be Used For Scalping?
Multiple-timeframe structure analysis can be incorporated into scalping strategies. Traders may use larger timeframes for directional context and smaller timeframes for entry evaluation. Shorter timeframes generally involve more market noise and false signals.
Can The Indicator Be Used For Swing Trading?
Yes. Multiple-timeframe market structure analysis can also be useful for swing traders who hold positions over longer periods. Daily and 4-hour charts may provide useful context for evaluating potential swing trading opportunities.
Does A Break Of Structure Guarantee A Winning Trade?
No. A Break of Structure is not a guarantee of future price direction. False breakouts, liquidity movements, economic announcements, and changing market conditions can all affect the outcome of a trade.
What Is The Best Timeframe For Using The Almazov Trade MTF Structure And BOS Entries Indicator?
There is no universally best timeframe. Traders should select timeframes that match their trading strategy, experience, and holding period. Multiple-timeframe analysis can help provide a more complete understanding of market conditions.
Risk Disclaimer: Forex trading involves substantial risk and is not suitable for every investor. Technical indicators provide analytical information, not guaranteed trading results. Always practice proper risk management and evaluate trading strategies using historical testing and demo trading before risking real capital.
👉 “Get Instant Access (Check Your Email)”
💥 IMPORTANT: One Last Step Required
After you enter your email, check your inbox (or spam folder) for a confirmation email.
👉 Click the confirmation link so I can send you your free Forex training.
⚠️ If you don’t confirm, I can’t send you anything.
👉 “⚠️ Access expires if not confirmed within 24 hours minutes.”
👉 “Takes 10 seconds. Instant access after email confirmation.”