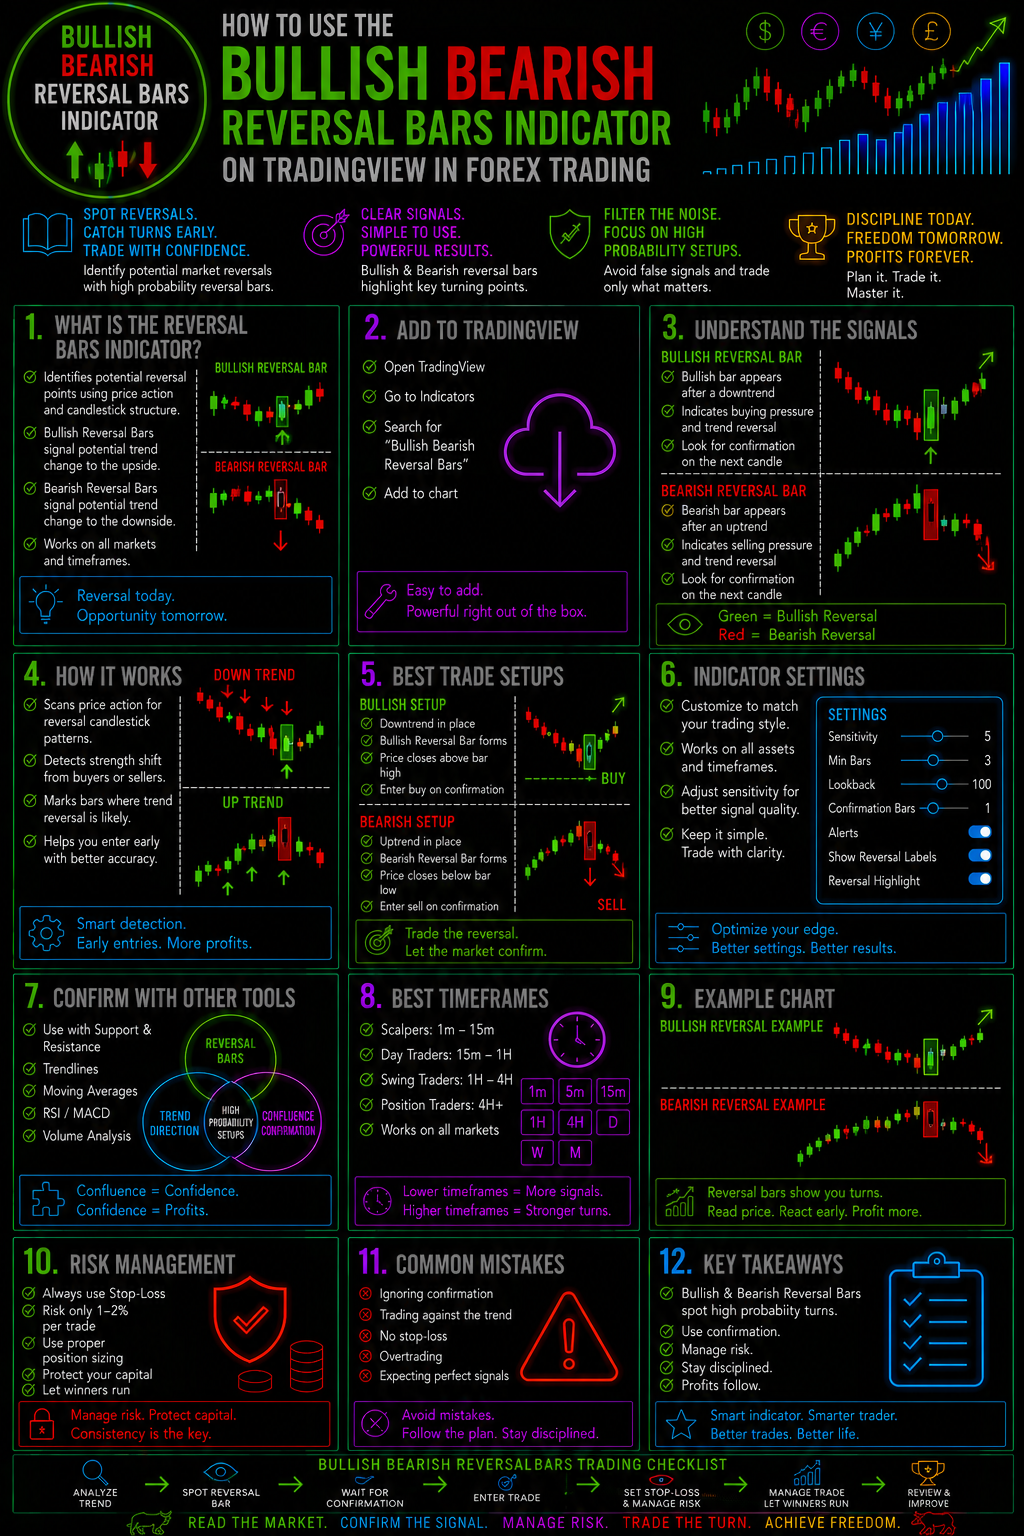
How To Use The Bullish Bearish Reversal Bars Indicator On TradingView In Forex Trading
Master Forex Reversal Signals Before The Market Turns
What if you could spot potential bullish and bearish reversals directly on your TradingView chart—before committing to a trade?
The Bullish Bearish Reversal Bars Indicator is designed to help Forex traders identify price bars that may signal a change in market direction. When combined with trend analysis, support and resistance, market structure, and disciplined risk management, reversal bars can become a powerful component of a complete Forex trading strategy.
This guide from Forex Trading Unlocked shows you how to use the indicator, how to interpret bullish and bearish reversal signals, and how to integrate those signals into a higher-probability trading process.
Don't just react to price. Learn how to read the potential shift.
What Is The Bullish Bearish Reversal Bars Indicator?
The Bullish Bearish Reversal Bars Indicator is a TradingView-based technical analysis tool designed to highlight potentially significant bullish and bearish reversal bars on a price chart.
The objective is simple:
Help traders recognize when price action may be transitioning from one directional bias to another.
A bullish reversal signal can draw attention to conditions where selling pressure may be weakening and buyers may be stepping in.
A bearish reversal signal can highlight conditions where buying pressure may be weakening and sellers may be gaining control.
But there is an important distinction:
A reversal signal is not automatically a trade signal.
The strongest applications come from combining the indicator with the broader market environment.
That is where the real trading edge can begin.
Why Reversal Bars Matter In Forex Trading
Forex markets constantly move through cycles of:
Trend → Exhaustion → Reversal → New Trend
The difficult part is identifying when the market is actually transitioning.
A trader who enters too early can get trapped by a temporary pullback.
A trader who enters too late can miss a significant portion of the move.
Reversal bars provide another piece of information that can help traders evaluate that transition.
For example, imagine EUR/USD has been declining into a major support level.
Price begins showing signs of rejection.
Then a bullish reversal bar appears.
Instead of immediately buying, the trader can ask:
- Is price at meaningful support?
- Is the larger trend weakening?
- Is market structure beginning to change?
- Is momentum improving?
- Has the reversal been confirmed?
- Where would the trade become invalid?
- Is the potential reward worth the risk?
This creates a process, rather than simply reacting to an indicator.
Bullish Reversal Bars Explained
A bullish reversal bar suggests that buying pressure may be increasing after a period of selling.
The signal becomes particularly interesting when it appears around an important technical location.Potential bullish reversal locations include:
- Major support
- Previous swing lows
- Fibonacci retracement zones
- Demand zones
- Oversold conditions
- Trendline support
- Previous breakout areas
- Higher-timeframe support
The key is confluence.
A bullish reversal signal occurring randomly in the middle of a range is not necessarily as compelling as a bullish reversal signal appearing at a well-established support level.The Basic Bullish Sequence
Downtrend → Support → Selling Weakens → Bullish Reversal Bar → Confirmation → Potential Long Setup
This sequence gives traders a framework for evaluating the signal rather than blindly entering whenever the indicator produces a bullish indication.
Bearish Reversal Bars Explained
Bearish reversal bars work from the opposite perspective.
They can draw attention to situations where buying pressure may be weakening and sellers could potentially regain control.
Again, location matters.
A bearish reversal signal near major resistance may deserve considerably more attention than the same signal appearing in the middle of an established bullish trend.Potential bearish reversal locations include:The Basic Bearish Sequence
- Major resistance
- Previous swing highs
- Fibonacci retracement zones
- Supply zones
- Overextended price moves
- Trendline resistance
- Previous breakdown areas
- Higher-timeframe resistance
Uptrend → Resistance → Buying Weakens → Bearish Reversal Bar → Confirmation → Potential Short Setup
The indicator helps identify the potential reversal.
Your analysis determines whether the potential reversal is worth trading.
How To Add The Indicator To TradingView
Adding the Bullish Bearish Reversal Bars Indicator to TradingView is straightforward.
Step 1: Open TradingView
Open your TradingView chart and select the Forex pair you want to analyze.
Step 2: Select Indicators
Use the Indicators function at the top of the TradingView chart.
Step 3: Search For The Indicator
Search for:
Bullish Bearish Reversal Bars
Select the appropriate indicator from the available results.
Step 4: Apply It To Your Chart
Once added, the indicator will display its reversal information directly on your price chart.
Step 5: Customize The Settings
Depending on the version of the indicator you are using, review the available settings and adjust them to fit your trading methodology.
Avoid the temptation to constantly optimize settings simply to make historical signals appear better.
A beautiful historical chart does not guarantee better future trades.
How To Read Bullish And Bearish Signals
Once the indicator is installed, the next step is learning how to interpret its signals.
Don't begin with:
"Bullish signal = Buy."
Instead ask:
"Why is the indicator producing a bullish signal here?"
That question changes everything.
Look at:
1. Market Trend
Is the market trending higher, trending lower, or moving sideways?
2. Market Structure
Where are the most recent:
- Higher highs?
- Higher lows?
- Lower highs?
- Lower lows?
3. Support And Resistance
Is the reversal occurring at a significant technical level?
4. Price Action
What is price actually doing around the signal?
5. Momentum
Is momentum supporting the potential reversal?
6. Higher Time Frame
Does the larger chart agree with the reversal?
The more factors supporting the same conclusion, the stronger the overall trading thesis can become.
The Multi-Time-Frame Reversal Strategy
One of the most powerful ways to use reversal signals is through multi-time-frame analysis.
Instead of looking at one chart, analyze the market from multiple perspectives.
For example:Higher Time Frame
Use the Daily or 4-Hour chart to identify:Trading Time Frame
- Major trend
- Major support
- Major resistance
- Important swing points
Use the 1-Hour or 30-Minute chart to identify:Entry Time Frame
- Market structure
- Pullbacks
- Reversal areas
- Potential setups
Use a lower timeframe to refine:
- Entry timing
- Confirmation
- Stop placement
- Risk/reward
This approach can help prevent a trader from taking a bullish reversal signal directly into major higher-timeframe resistance—or a bearish reversal signal directly into major support.
Bullish Reversal Trade Example
Imagine GBP/USD has been trending lower.
Price approaches a significant support zone.
The market begins showing signs that sellers are losing momentum.
A bullish reversal bar appears.
Rather than immediately entering, the trader waits for confirmation.
A potential process could look like this:
1. Identify support.
2. Wait for the bullish reversal signal.
3. Examine the surrounding price action.
4. Look for confirmation of improving bullish structure.
5. Define the entry.
6. Establish the stop-loss before entering.
7. Identify a logical profit target.
8. Calculate the risk/reward ratio.
9. Execute only if the setup meets the trading plan.
The important lesson is that the indicator starts the investigation—it doesn't finish it.
Bearish Reversal Trade Example
Now consider USD/JPY moving higher toward major resistance.
Price begins struggling to continue upward.
A bearish reversal bar appears near the resistance zone.
The trader can then evaluate whether:
- The bullish trend is weakening.
- Price is rejecting resistance.
- Market structure is changing.
- Momentum is deteriorating.
- Lower-timeframe confirmation is developing.
- The potential short has acceptable risk/reward.
If those conditions align, the bearish reversal signal may become part of a structured short-selling setup.
Combine Reversal Bars With Support And Resistance
This is one of the most important concepts on the entire page.
Location matters.
A reversal signal by itself provides limited context.
A reversal signal occurring at an important price level provides considerably more information.
Consider this:
Setup A
Bullish reversal signal appears randomly during a downtrend.
Setup B
Bullish reversal signal appears at major historical support after an extended decline.
Setup B may deserve greater attention because multiple pieces of market information are aligning.
This is the foundation of confluence trading.
Combine The Indicator With Fibonacci
Fibonacci retracement levels can provide another layer of confirmation.
After identifying a significant market swing, traders can examine common retracement areas such as:
38.2%
50%
61.8%
78.6%
A bullish reversal occurring around a meaningful Fibonacci retracement level may provide additional context for a potential long setup.
Likewise, bearish reversal signals around important Fibonacci retracement or extension areas can help traders evaluate potential short setups.
The goal isn't to use every Fibonacci level on every chart.
The goal is to identify high-value areas where multiple technical factors intersect.
Reversal Bars And Market Structure
Market structure is one of the best filters for indicator-based trading.
A bullish reversal becomes more interesting when price begins transitioning from:
Lower Low → Lower High → Higher Low → Higher High
A bearish reversal becomes more interesting when price begins transitioning from:
Higher High → Higher Low → Lower High → Lower Low
The reversal indicator can help draw your attention to the potential turning point.
Market structure helps determine whether the market is actually changing character.
Don't Make This Common Trading Mistake
One of the biggest mistakes traders make with reversal indicators is taking every signal.
Markets generate noise.
Not every reversal attempt becomes a major trend reversal.
Sometimes price will:
Reverse → Trigger a signal → Continue in the original direction.
This is why professional trading is not about finding an indicator that is right every time.
It is about creating a system where:
Good setups are traded.
Bad setups are filtered.
Risk is controlled.
Losses are expected.
Profits are allowed to develop.
How To Use The Indicator For Scalping
The Bullish Bearish Reversal Bars Indicator can also be incorporated into shorter-term trading strategies.
However, lower timeframes generally contain more market noise.
For scalpers, consider using:
- Higher-timeframe trend direction
- Key intraday support and resistance
- Session highs and lows
- Market structure
- Reversal signals
- Tight but logical risk controls
Avoid using a lower timeframe simply because it produces more signals.
More signals do not automatically mean more opportunities.
They can also mean more false signals.
👉 “Get Instant Access (Check Your Email)”
💥 IMPORTANT: One Last Step Required
After you enter your email, check your inbox (or spam folder) for a confirmation email.
👉 Click the confirmation link so I can send you your free Forex training.
⚠️ If you don’t confirm, I can’t send you anything.
👉 “⚠️ Access expires if not confirmed within 24 hours minutes.”
👉 “Takes 10 seconds. Instant access after email confirmation.”