How to Use the Delta Pressure Indicator on TradingView in Forex Trading
Discover Buying and Selling Pressure Before You Make Your Next Forex Trade
Are buyers gaining control of the market, or are sellers preparing to take over? Understanding the battle between buying and selling pressure can help forex traders evaluate market momentum, recognize potential shifts in price direction, and make more informed trading decisions.
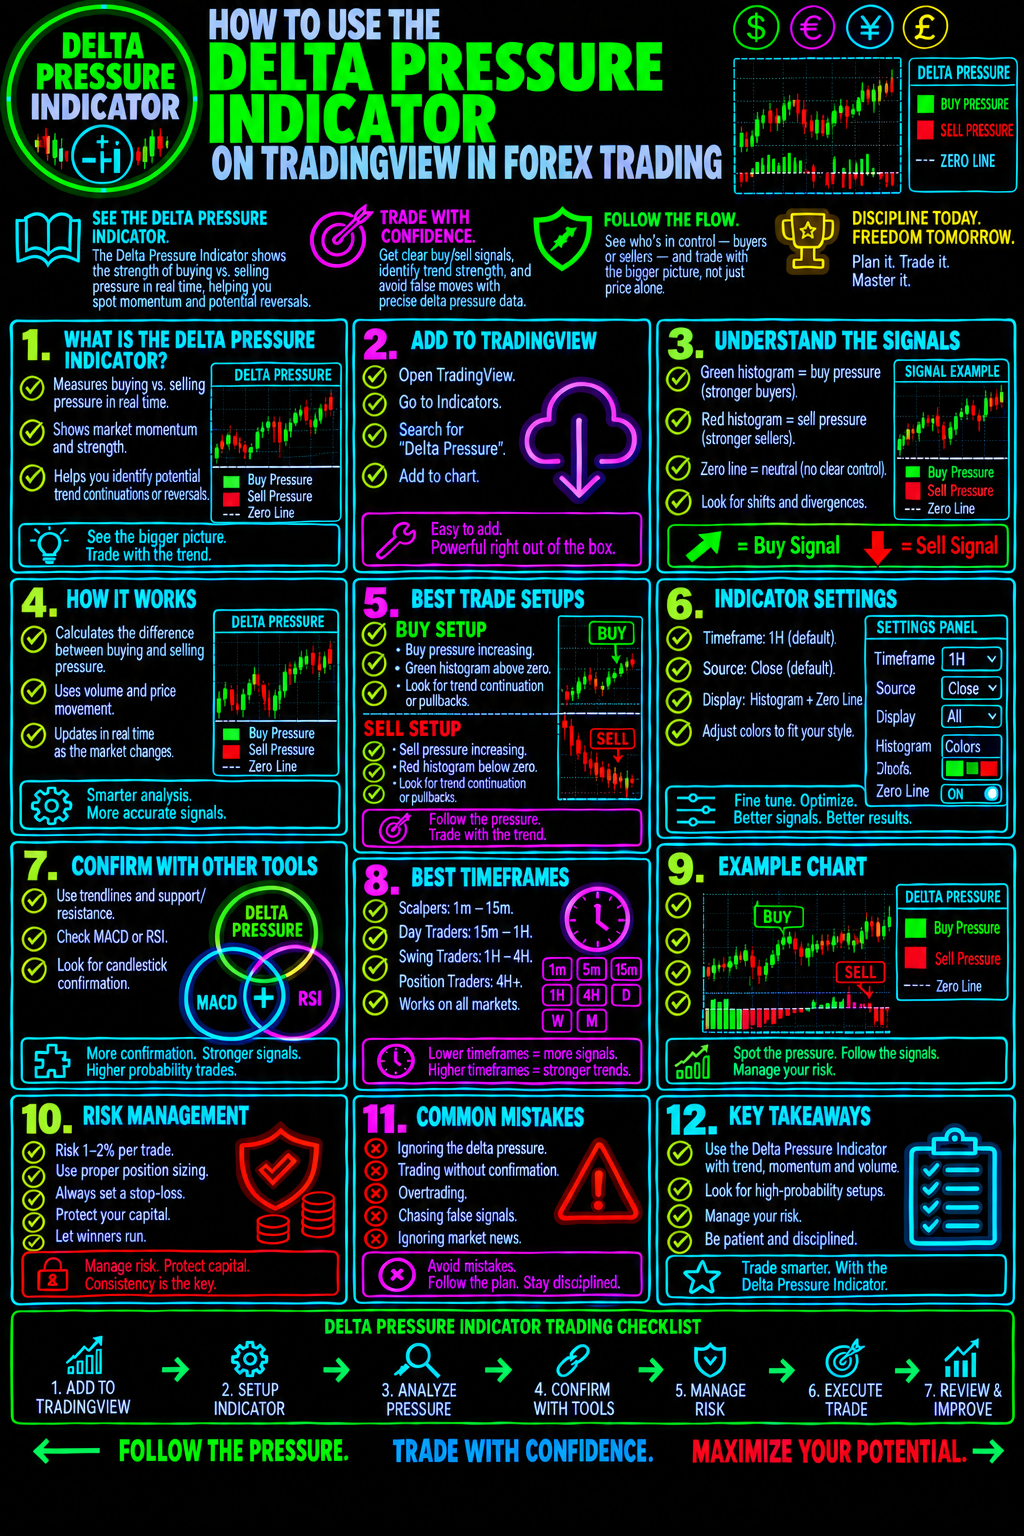
The Delta Pressure Indicator on TradingView can help traders analyze buying and selling pressure to gain additional insight into market behavior. Instead of relying exclusively on candlestick patterns or price direction, traders can use pressure-based information alongside price action, trend analysis, and support and resistance to build a more complete trading strategy.
At Forex Trading Unlocked, we believe successful forex trading starts with understanding what the market is doing, identifying high-probability opportunities, and managing risk before entering a position.
In this guide, you will learn how to use the Delta Pressure Indicator, how to interpret its signals, how to combine it with other technical analysis tools, and how to incorporate it into a disciplined forex trading plan.
Ready to sharpen your forex trading skills? Let's get started.
What Is the Delta Pressure Indicator?
The Delta Pressure Indicator is a TradingView charting tool designed to help traders assess the balance between buying and selling pressure. Depending on the specific version of the indicator, it may use volume-related calculations, price movement, or other data to estimate which side of the market is exerting greater pressure.
The objective is to help traders evaluate whether bullish or bearish forces appear to be gaining strength.
In forex trading, price movements reflect the interaction of buyers and sellers across a decentralized global market. However, not every increase in price signals a strong bullish trend, and not every decline indicates sustained selling pressure.
A pressure-based indicator can provide additional context when evaluating these movements.
Traders may use the Delta Pressure Indicator to help:
- Evaluate potential shifts in buying and selling pressure.
- Confirm or question the strength of an existing trend.
- Identify possible momentum changes.
- Analyze price behavior near support and resistance.
- Look for confirmation before entering a trade.
- Improve the consistency of a technical trading strategy.
Important: TradingView offers different community-developed indicators, and their formulas and features may differ. The exact calculations and interpretation of signals depend on the particular Delta Pressure Indicator you select. Pressure estimates should not automatically be treated as verified order-flow data or proof of institutional buying and selling.
Why Buying and Selling Pressure Matters in Forex Trading
Forex prices constantly respond to changing expectations about interest rates, inflation, economic growth, central bank policy, and global risk sentiment.
Technical traders attempt to interpret how these forces are reflected in price action.
Buying pressure can contribute to rising prices, while selling pressure can contribute to falling prices. However, the relationship is not always straightforward. Price can rise while bullish momentum weakens, or price can decline even when selling pressure appears to be losing strength.
These situations can create useful areas for further analysis.
Consider three common market conditions:
1. Increasing Buying Pressure
When price is advancing and the indicator suggests increasing buying pressure, the readings may support a bullish continuation scenario. Traders can then look for confirmation from trend structure, moving averages, or a breakout above resistance.
2. Increasing Selling Pressure
When price is declining and selling pressure appears to be increasing, the readings may support a bearish continuation scenario. Traders can examine lower highs, lower lows, and breaks below established support.
3. Conflicting Price and Pressure Readings
When price moves higher but the indicator suggests weakening buying pressure, traders may want to investigate whether bullish momentum is fading. The same principle applies when price falls but selling pressure appears to weaken.
Conflicting readings do not guarantee a reversal. They simply provide a reason to examine the market more carefully.
How to Find the Delta Pressure Indicator on TradingView
TradingView provides charting tools and community-published indicators that traders can use to develop their technical analysis.
Follow these steps to locate and evaluate the appropriate indicator.
Visit TradingView and open a chart for the forex pair you want to analyze.
You can begin with a widely traded currency pair such as EURUSD, GBPUSD, or USDJPY.
Choose a pair you understand and regularly follow so you can compare the indicator's readings with familiar price behavior.
Step 2: Open the Indicators Menu
Locate the Indicators button on the TradingView chart interface.
Use the search function to look for Delta Pressure.
Review the available results carefully. Community scripts with similar names may use different calculations, display different signals, or require different settings.
Step 3: Review the Indicator Description
Before adding an indicator to your chart, examine its description and documentation.
Look for information explaining:
- How buying and selling pressure is calculated.
- Whether the indicator uses volume, price movement, or another input.
- How bullish and bearish conditions are displayed.
- Whether the indicator includes alerts or additional filters.
- Whether its signals update during an active candle.
- Whether the author documents limitations or recommended settings.
Do not assume that two indicators with similar names use the same methodology.
Step 4: Add the Indicator to Your Chart
Select the appropriate script and add it to your chart.
Observe how the indicator is displayed and whether its readings appear in a separate panel or directly on the price chart.
If the indicator includes customizable settings, begin with the default configuration. Change one setting at a time so you can evaluate how each adjustment affects the readings.
Step 5: Observe the Indicator Under Different Market Conditions
Before risking money, study the indicator during trending markets, sideways markets, breakouts, and pullbacks.
Look for recurring relationships between its readings and subsequent price behavior.
This process helps you determine whether the indicator adds useful information to your existing trading approach.
How to Interpret the Delta Pressure Indicator
The correct interpretation depends on the specific script you use. The following framework explains how to evaluate buying and selling pressure without assuming that every version displays the same signals.
Bullish Pressure: When Buyers May Be Gaining Control
A bullish pressure reading may indicate that buying activity or bullish price behavior is strengthening according to the indicator's calculation.
Rather than buying immediately, evaluate the broader market structure.
Look for supporting evidence such as:
- Price trading above a rising trendline or moving average.
- Higher highs and higher lows.
- A successful breakout above resistance.
- A pullback that holds above a previous support level.
- A bullish candlestick pattern at a technically meaningful location.
When several independent factors align, the bullish scenario may deserve further consideration.
For example, suppose EURUSD breaks above resistance, pulls back toward the breakout level, and then forms a bullish rejection candle. If the Delta Pressure Indicator also shows strengthening buying pressure, that combination may provide a more structured entry opportunity than relying on the indicator alone.
The trade still requires a defined invalidation level and acceptable risk.
Bearish Pressure: When Sellers May Be Gaining Control
A bearish pressure reading may indicate that selling activity or bearish price behavior is strengthening.
Before considering a short position, look for evidence that the broader chart supports a bearish scenario.
Potential confirmation includes:
- Price forming lower highs and lower lows.
- A break below established support.
- A failed attempt to reclaim a broken support level.
- Bearish candlestick patterns near resistance.
- A broader downtrend supported by moving averages or other trend analysis.
Imagine that GBPUSD falls below support, rallies back toward the broken level, and fails to recover it. If the Delta Pressure Indicator simultaneously suggests increasing selling pressure, the combination may support a bearish continuation setup.
However, a sudden change in economic expectations or an unexpected news release can invalidate an otherwise attractive technical pattern.
Weakening Pressure: A Potential Warning Sign
A change in pressure readings may alert traders to a possible loss of momentum.
For example, price might continue making higher highs while the indicator's bullish readings become weaker.
This could suggest that the advance deserves closer examination.
It does not establish that sellers have taken control, nor does it guarantee that price will reverse.
A more disciplined approach is to wait for additional evidence, such as a break in market structure, a failed breakout, or a confirmed reversal pattern.
The key principle: Use the Delta Pressure Indicator to help evaluate market conditions, not to predict every price movement.
How to Combine the Delta Pressure Indicator With Other Forex Trading Tools
1. Combine Delta Pressure With Support and Resistance
Support and resistance levels help traders identify areas where price has previously encountered buying or selling interest.
The Delta Pressure Indicator may provide additional context when price approaches these levels.
For a potential bullish setup, look for price to test support and show signs of stabilization while pressure readings become more favorable.
For a potential bearish setup, look for price to test resistance and struggle to advance while selling pressure strengthens.
Learn more about identifying important price levels in our guide to Forex Support and Resistance Trading.
2. Combine Delta Pressure With Candlestick Patterns
Candlestick patterns can help traders interpret how price behaves at important levels.
A bullish engulfing pattern, hammer, or other bullish rejection candle may provide evidence that buyers are responding to a support area.
A bearish engulfing pattern, shooting star, or bearish rejection candle may suggest that sellers are responding to resistance.
When the Delta Pressure Indicator supports the same scenario, the trader has another piece of information to evaluate.
Neither the candlestick pattern nor the indicator guarantees a successful trade.
Learn how to recognize these opportunities in our guide to High-Probability Japanese Candlestick Patterns.
3. Combine Delta Pressure With Moving Averages
Moving averages can help identify the broader trend and reduce the temptation to trade against prevailing market direction.
For example, a trader might look for bullish pressure readings when price is above a rising moving average.
In a bearish market, the trader might prioritize bearish pressure readings when price is below a declining moving average.
This approach can help create a more consistent decision-making process.
Moving averages are lagging indicators, however, and can generate misleading signals in sideways markets.
4. Combine Delta Pressure With the Relative Strength Index
The Relative Strength Index, or RSI, measures the speed and magnitude of recent price changes.
Traders use RSI to evaluate momentum, identify potential overbought or oversold conditions, and study possible divergences.
Delta Pressure and RSI may provide complementary information, but they do not measure exactly the same thing.
If bullish pressure strengthens while RSI also improves, the readings may support a bullish scenario. If price continues rising while momentum readings weaken, traders may want to evaluate the risk of a pullback.
Avoid treating an overbought or oversold reading as an automatic entry signal.
5. Combine Delta Pressure With the Average Directional Index
The Average Directional Index, or ADX, is commonly used to evaluate trend strength.
A trader may use ADX to assess whether a market is trending or moving sideways, then use the Delta Pressure Indicator to evaluate the direction of the potential trade.
For example, a strengthening trend combined with favorable pressure readings may support a trend-continuation setup.
In a weak or sideways market, conflicting readings may justify greater caution.
Explore additional tools in our guide to Forex Technical Indicators and Trading Strategies.
A Practical Delta Pressure Forex Trading Strategy
The following framework can help you test how the indicator fits into a repeatable trading process.
It is an educational example, not a validated or guaranteed profitable strategy. You should test the rules on historical data and in a demo account before considering live trading.
Step 1: Identify the Overall Trend
Start with a higher timeframe to establish the broader market structure.
For example, a swing trader might examine the daily chart before looking for an entry on the four-hour chart.
Determine whether the market is trending upward, trending downward, or moving sideways.
Mark the most relevant support and resistance levels.
Step 2: Wait for Price to Reach an Important Area
Avoid entering trades simply because the indicator changes color or displays a new reading.
Instead, wait for price to approach a location where a trade could have a clearly defined invalidation point.
Examples include:
- A retest of broken resistance.
- A pullback toward established support.
- A rejection near a previous swing high.
- A breakdown below a well-defined trading range.
Step 3: Evaluate Buying or Selling Pressure
Check whether the indicator supports the scenario you are considering.
For a bullish trade, look for pressure readings consistent with buyers gaining strength.
For a bearish trade, look for pressure readings consistent with sellers gaining strength.
If the indicator contradicts the price structure, wait for additional information rather than forcing a trade.
Step 4: Require Price Confirmation
Use a predefined confirmation rule.
For example, a bullish setup might require a completed bullish rejection candle followed by a break above that candle's high. A bearish setup might require a completed bearish rejection candle followed by a break below its low.
These are example rules, not universal requirements. Your testing should determine which conditions, if any, add value.
Whenever possible, evaluate signals after the relevant candle closes. Some indicators can change their readings while a candle is forming.
Step 5: Define Your Stop-Loss Before Entering
Determine where the trade idea would be invalidated.
A stop-loss may be placed beyond a relevant swing high or low, adjusted for market volatility and the pair's trading conditions.
The distance between entry and stop-loss must be considered alongside position size.
Never choose a position size first and then force the stop-loss into an unsuitable location.
Step 6: Establish a Realistic Profit Target
Identify the next significant support or resistance level, or use a predefined reward-to-risk framework.
For example, a hypothetical setup with a 20-pip stop-loss and a 40-pip profit target offers a potential 2:1 reward-to-risk ratio before trading costs.
That does not mean the trade has a high probability of success.
Your strategy's actual expectancy depends on win rate, average win, average loss, spreads, commissions, slippage, and execution quality.
Step 7: Record and Review the Results
Keep a trading journal documenting:
- Currency pair and timeframe.
- Market conditions.
- Indicator readings at the time of the trade.
- Entry, stop-loss, and profit target.
- The reason for entering.
- Whether every rule was followed.
- Final outcome and lessons learned.
Review enough trades to evaluate whether the indicator improves your process rather than simply making individual trades look more convincing after the fact.
Which Forex Timeframes Work Best With the Delta Pressure Indicator?
There is no universally best timeframe for the Delta Pressure Indicator. The appropriate choice depends on the indicator's design, the trading strategy, and your available time.
Scalping: Shorter timeframes provide frequent signals but can also contain substantial noise. Spreads, execution costs, and rapid price changes are especially important.
Day trading: Five-minute, fifteen-minute, and one-hour charts may help intraday traders evaluate developing price movements. A higher timeframe can provide context for the trading session.
Swing trading: Four-hour and daily charts can help traders focus on larger price structures and reduce the need to monitor every short-term fluctuation.
Position trading: Daily and weekly charts can help longer-term traders evaluate broader market trends and significant technical levels.
Do not assume that an indicator setting or strategy that works on one timeframe will work equally well on another.
Test the indicator on the currency pairs and timeframes you actually intend to trade.
Common Delta Pressure Indicator Mistakes to Avoid
Even a useful indicator can become counterproductive when traders use it without a clear process.Mistake 1: Treating Every Signal as a Trade
Not every bullish reading is a buy opportunity, and not every bearish reading is a sell opportunity.
A signal appearing directly beneath major resistance, for example, may offer an unattractive risk profile even if the indicator looks bullish.
Better approach: Evaluate market structure, trade location, and risk before entering.
Mistake 2: Ignoring the Overall Trend
Short-term pressure readings can conflict with a larger trend.
Countertrend trades may work, but they require a clear rationale and careful risk management.
Better approach: Define the higher-timeframe context before evaluating an entry.
Mistake 3: Using Too Many Indicators
Adding more indicators does not necessarily improve your trading decisions.
Several tools may rely on similar price inputs and therefore provide redundant information.
Better approach: Build a simple strategy in which every tool has a specific purpose.
Mistake 4: Assuming Pressure Readings Reveal the Entire Forex Order Book
Spot forex is a decentralized market. TradingView indicators may use different data sources or calculations, and a pressure estimate is not automatically a complete picture of buying and selling across the global currency market.
Better approach: Read the script's documentation and understand what its readings actually represent.
Mistake 5: Failing to Manage Risk
Even a technically sound setup can lose money.
Oversized positions, poorly placed stops, excessive leverage, and emotional decision-making can quickly undermine a trading account.
Better approach: Define your maximum acceptable risk before entering any trade.
Mistake 6: Failing to Test the Strategy
A few profitable trades do not prove that a strategy has a durable edge.
Better approach: Test the rules across different market conditions, include realistic trading costs, and evaluate out-of-sample results where possible.
Delta Pressure Indicator vs. Other Forex Indicators
Each technical tool serves a different purpose. The goal is not to find one indicator that does everything, but to understand how different tools can complement one another.
Indicator Primary Purpose How It Can Complement Delta Pressure
Delta Pressure Evaluates buying and selling pressure according to the script's methodology Helps assess pressure-related market conditions
RSI Measures price momentum Provides additional momentum context
Moving Averages Helps identify trend direction Establishes broader directional bias
ADX Measures trend strength Helps assess whether a market is trending
MACD Evaluates momentum and trend-related relationships Provides another view of momentum changes
Support Identifies important price levels Helps evaluate where pressure changes matter most
and Resistance
No combination guarantees profitable results. The best setup is one you can explain, test, and execute consistently.
How to Build a Complete Forex Trading System Around Delta Pressure
The Delta Pressure Indicator should be one component of a complete trading plan, not a substitute for one.
A structured system answers five essential questions:
1. What is the market doing?
Determine the overall trend, market structure, and relevant economic context.
2. Where is the opportunity?
Identify support, resistance, pullbacks, breakouts, or other locations that fit your strategy.
3. What confirms the trade?
Use your predefined Delta Pressure rules and any additional confirmation criteria.
4. Where is the trade invalidated?
Establish your stop-loss and calculate position size before entering.
5. Is the potential reward worth the risk?
Evaluate the target, trading costs, and historical performance of the setup.
When these questions are answered before the trade begins, you reduce the likelihood of making impulsive decisions based on a single indicator reading.
Take Your Forex Trading Knowledge Further
Forex Trading Unlocked provides educational resources designed to help traders develop stronger technical analysis, trading strategies, and risk-management habits.
Continue building your trading knowledge with these resources:
- Forex Trading Guide: Strengthen your understanding of the forex market and trading fundamentals.
- High-Probability Japanese Candlestick Patterns: Learn to evaluate candlestick formations and price behavior.
- Forex Support and Resistance: Understand how important price levels can shape trade opportunities.
- Forex Technical Indicators: Explore additional tools for analyzing trends and momentum.
- TradingView: Access charting tools to analyze currency pairs and test your technical trading ideas.
The more you understand how price action, momentum, market structure, and risk management work together, the better equipped you will be to evaluate trading opportunities.
Frequently Asked Questions About the Delta Pressure Indicator
What does the Delta Pressure Indicator show?
It provides an assessment of buying and selling pressure based on the particular indicator's methodology. Depending on the script, this assessment may use price data, volume-related inputs, or other calculations.
Is the Delta Pressure Indicator available on TradingView?
Search for Delta Pressure in TradingView's Indicators menu. Check the script description and author documentation because similarly named indicators may differ in their calculations and functionality.
Can the Delta Pressure Indicator predict forex reversals?
It may help traders identify conditions consistent with changing pressure or weakening momentum. However, it cannot reliably predict every reversal, and readings should be evaluated alongside price structure and other evidence.
Is the Delta Pressure Indicator suitable for beginners?
Beginners can study it as part of their technical analysis education. Before trading live, they should understand the indicator's limitations, learn basic chart analysis, and practice a complete risk-management process in a demo account.
Can I use the Delta Pressure Indicator for scalping?
Potentially, depending on the specific script and strategy. Short timeframes can produce more noise and make trading costs more significant. Backtesting and forward testing are essential before relying on short-term signals.
Should I use the Delta Pressure Indicator by itself?
It is generally more prudent to evaluate an indicator within a broader trading framework. Trend direction, support and resistance, price confirmation, and position sizing can all contribute to a more disciplined decision-making process.
Does the Delta Pressure Indicator guarantee profitable forex trades?
No. No technical indicator guarantees profits or eliminates trading risk. Results depend on the strategy, market conditions, execution, and risk management.
Final Thoughts: Use Delta Pressure to Make More Informed Trading Decisions
The Delta Pressure Indicator on TradingView can offer another perspective on the relationship between buying and selling pressure in the forex market.
Its greatest potential value lies in helping you ask better questions: Are buyers gaining strength? Are sellers taking control? Is price confirming the pressure reading? Is the market approaching an important technical level?
But the indicator alone cannot answer every question, predict every reversal, or guarantee a winning trade.
The strongest approach is to combine pressure analysis with market structure, candlestick confirmation, trend evaluation, and disciplined risk management. Then test your rules, document your results, and refine your process based on evidence rather than emotion.
Want to become a more disciplined and better-prepared forex trader?
Explore the educational resources at Forex Trading Unlocked and continue building the skills needed to analyze the market, recognize potential opportunities, and manage risk with greater confidence.
Study the market. Plan the trade. Manage the risk. Trade with a process.
Risk Disclaimer: Forex and leveraged trading involve substantial risk and may not be suitable for every investor. You can lose some or all of your invested capital. Technical indicators are analytical tools, not guarantees of future performance. Always conduct your own research and use appropriate risk-management practices.
👉 “Get Instant Access (Check Your Email)”
💥 IMPORTANT: One Last Step Required
After you enter your email, check your inbox (or spam folder) for a confirmation email.
👉 Click the confirmation link so I can send you your free Forex training.
⚠️ If you don’t confirm, I can’t send you anything.
👉 “⚠️ Access expires if not confirmed within 24 hours minutes.”
👉 “Takes 10 seconds. Instant access after email confirmation.”