How to Use the Divergence Scanner Indicator on TradingView in Forex Trading
Discover Potential Forex Reversals Before the Market Makes Its Next Move
What if you could identify potential changes in forex market momentum before they become obvious on the price chart?
The Divergence Scanner Indicator on TradingView helps forex traders search for potential divergence between price action and momentum. Divergence can provide valuable clues that a prevailing trend may be weakening, a reversal could be developing, or a temporary pullback deserves closer attention.
But identifying divergence is only the beginning. Successful forex trading requires more than recognizing a signal. You need to understand market structure, confirm the direction of the trend, identify high-probability entry zones, and manage risk before placing a trade.
At Forex Trading Unlocked, we help traders turn technical analysis into a structured trading process. In this guide, you will learn how to use a Divergence Scanner Indicator, interpret its signals, combine divergence with other technical tools, and develop a more disciplined approach to forex trading.
Your goal is not to trade every divergence. Your goal is to recognize the divergence signals that align with your trading strategy.
What Is the Divergence Scanner Indicator?
The Divergence Scanner Indicator is a technical analysis tool designed to help traders identify potential divergences between price movement and an underlying momentum indicator.
Divergence occurs when price action and an indicator move in different directions or fail to confirm one another.
For example, a currency pair might establish a new high while a momentum indicator forms a lower high. This bearish divergence suggests that upward momentum may be weakening, even though the market continues to rise.
Conversely, a currency pair might establish a new low while the momentum indicator forms a higher low. This bullish divergence can indicate that selling pressure may be losing strength.
Depending on the specific Divergence Scanner script, the indicator may scan for different divergence types, display signals directly on the chart, or identify potential divergence across multiple instruments or timeframes. Features vary by script, so always review the indicator's description and settings before using it.
The important distinction is that divergence identifies a potential change in momentum. It does not guarantee a trend reversal or provide an automatic buy or sell decision.
Why Forex Traders Use a Divergence Scanner
Forex markets frequently experience changes in momentum before price direction changes decisively. A divergence scanner can help traders examine these developments without relying exclusively on visual chart inspection.
Here are several ways divergence analysis can support your trading decisions.
1. Identify Potential Bearish Reversals
When price makes a higher high but the momentum indicator makes a lower high, bearish divergence may be developing.
This can alert traders to a possible weakening of bullish momentum. Rather than selling immediately, traders can look for additional evidence, such as a break of market structure, a bearish candlestick pattern, or a rejection from resistance.
2. Recognize Potential Bullish Reversals
Bullish divergence occurs when price establishes a lower low while the indicator establishes a higher low.
This may suggest that bearish momentum is fading. Traders can then watch for bullish confirmation, particularly around established support levels or important demand zones.
3. Improve Your Market Timing
Divergence can help traders evaluate whether an existing trend still has momentum behind it.
When combined with support and resistance, trend analysis, and price-action confirmation, divergence may help narrow down potential trading opportunities.
4. Reduce the Time Spent Searching Charts
If your selected scanner supports automated divergence detection, it may help you identify potential setups more efficiently than checking every chart manually.
However, automated detection does not eliminate the need to verify signals. The underlying script, pivot settings, timeframe, and market conditions can affect what the scanner identifies.
Understanding the Main Types of Divergence
Before trading with a Divergence Scanner Indicator, you need to understand the difference between regular divergence and hidden divergence.Regular Bullish Divergence
Regular bullish divergence develops when:
- Price forms a lower low.
- The momentum indicator forms a higher low.
- Selling momentum may be weakening.
This pattern can appear near support during a downtrend or corrective move. It suggests that a bullish reversal may be possible, but confirmation is essential.
Potential trading approach: Wait for a bullish break of structure, a strong bullish candle, or another defined entry trigger before considering a long position.
Regular Bearish Divergence
Regular bearish divergence develops when:
- Price forms a higher high.
- The momentum indicator forms a lower high.
- Buying momentum may be weakening.
This pattern can appear near resistance or after an extended bullish move.
Potential trading approach: Look for bearish price-action confirmation, such as a rejection candle or a break below a relevant swing low, before considering a short position.
Hidden Bullish Divergence
Hidden bullish divergence occurs when price forms a higher low while the indicator forms a lower low.
Traders often interpret this pattern as a possible continuation signal within an existing uptrend.
Potential trading approach: Identify an established bullish trend, wait for a pullback, and look for hidden bullish divergence near a support area.
How to Find a Divergence Scanner Indicator on TradingView
TradingView provides a searchable library of community-created indicators and other technical analysis tools.
Follow these steps to locate a Divergence Scanner suitable for your forex trading strategy.
- Open TradingView and select the chart for the currency pair you want to analyze.
- Open the Indicators panel.
- Search for Divergence Scanner.
- Review the available scripts and read their descriptions.
- Check whether the script detects regular divergence, hidden divergence, or both.
- Review any available documentation explaining its settings, signal conditions, and limitations.
- Add your selected indicator to the chart and observe how it behaves on historical price data.
You can begin with a major forex pair such as EURUSD, GBPUSD, or USDJPY. Choose a timeframe appropriate for your strategy and use the same settings consistently while evaluating results.
Some community indicators may be invite-only, restricted, or dependent on a particular underlying indicator. Availability and functionality can change, so verify the current script details directly on TradingView.
How to Use the Divergence Scanner Indicator Step by Step
Finding divergence is useful only when you know how to incorporate it into a complete trading plan.
Step 1: Determine the Primary Market Trend
Before evaluating a divergence signal, identify whether the currency pair is trending upward, trending downward, or moving sideways.
Look for higher highs and higher lows in an uptrend. Look for lower highs and lower lows in a downtrend.
You can also use a moving average or a higher-timeframe chart to establish directional context.
For additional guidance, explore the Forex Trading Unlocked resources on trend identification and moving-average analysis.
Step 2: Identify Important Support and Resistance
Mark the areas where price has previously encountered buying or selling pressure.
These zones can help you evaluate whether a divergence signal appears in a technically meaningful location.
For example, bullish divergence near established support may deserve closer attention than the same signal appearing in the middle of an extended trading range.
Likewise, bearish divergence near resistance can provide a useful warning that an advance may be losing momentum.
Learn more in our Forex Support and Resistance Trading resources, where you can develop a more structured approach to identifying important price levels.
Step 3: Scan for Divergence Signals
Activate your chosen Divergence Scanner Indicator and examine the signals appearing on the chart.
Ask yourself:
- Is price making a higher high or lower low?
- Is the momentum indicator confirming that price movement?
- Is the signal regular divergence or hidden divergence?
- Does the signal appear near support, resistance, or a relevant market-structure level?
- Does the signal agree with the broader market context?
Avoid treating every marker, line, or alert as a trade recommendation. The scanner is a tool for identifying potential opportunities, not a substitute for analysis.
Step 4: Wait for Price-Action Confirmation
One of the most common mistakes traders make is entering immediately after divergence appears.
A market can continue moving in the same direction despite weakening momentum. Divergence can persist for multiple candles, and early entries may expose traders to unnecessary losses.
Instead, establish a confirmation rule before entering.
Possible confirmation methods include:
- A break of a recent swing high or swing low.
- A bullish or bearish candlestick reversal pattern.
- A break and retest of a significant price level.
- A rejection from a predefined support or resistance zone.
For a more complete understanding of candlestick confirmation, explore our High-Probability Japanese Candlestick Patterns guide:
https://www.forex-trading-unlocked.com/High-Probability-Japanese-Candlestick-Patterns.html
Learning to combine momentum analysis with price action can help you build a more consistent decision-making process.
Step 5: Define Your Entry, Stop-Loss, and Profit Target
Never enter a forex trade without knowing where the trade idea becomes invalid.
For a potential bullish setup, a stop-loss might be placed below a relevant swing low or support zone, depending on your strategy and volatility conditions.
For a potential bearish setup, a stop-loss might be placed above a relevant swing high or resistance zone.
Your profit target should be based on identifiable price levels, market structure, or a predefined reward-to-risk framework.
Do not place a stop-loss or profit target solely because an indicator displays a signal.
Step 6: Evaluate the Trade Before Committing Capital
Calculate the distance between your proposed entry and stop-loss. Then determine whether the potential reward justifies the risk.
For example, a hypothetical trade risking 20 pips to target 40 pips offers a 2:1 reward-to-risk ratio before transaction costs and slippage.
That does not mean the trade will be profitable. Your strategy still needs a measurable historical and forward-tested edge.
For a deeper understanding of position sizing and capital preservation, explore the Forex Trading Unlocked Risk Management Guide and build a repeatable process for controlling risk on every trade.
Combining Divergence with Other Trading Indicators
A Divergence Scanner becomes more useful when it fits into a broader technical analysis framework.
The objective is not to add as many indicators as possible. It is to combine tools that answer different questions about the market.
Divergence Scanner + RSI
The Relative Strength Index measures momentum and is commonly used to examine potential divergence and overbought or oversold conditions.
If your scanner already uses RSI to detect divergence, adding a separate RSI indicator may provide little additional information. If it uses another calculation, comparing the tools may help you understand the conditions behind its signals.
Learn how the RSI works and how traders interpret its readings in our forex indicator education resources.
Divergence Scanner + MACD
The Moving Average Convergence Divergence indicator helps traders assess momentum and trend changes.
A divergence signal followed by a meaningful MACD shift may provide additional context, depending on the market and timeframe.
However, indicators based on similar price data are not necessarily independent confirmations. Two indicators can produce similar signals and still be wrong.
Explore our MACD Forex Trading resources to understand how momentum analysis can complement price action.
Divergence Scanner + Moving Averages
Moving averages can help establish trend direction and provide context for potential pullbacks.
For example, a bullish divergence signal during an established uptrend may prompt you to watch for a pullback that stabilizes near a moving average or support area.
A bearish divergence signal during a sustained downtrend may help identify a potential end to a corrective rally.
Moving averages lag price, so use them as context rather than as guarantees of future direction.
Divergence Scanner + Support and Resistance
Support and resistance can help distinguish between a divergence signal appearing at a potentially important price level and one appearing in an arbitrary location.
When divergence, market structure, and a predefined price-action trigger align, you may have a more clearly defined setup to evaluate.
The key is to establish your rules before the trade rather than inventing reasons to enter after seeing a signal.
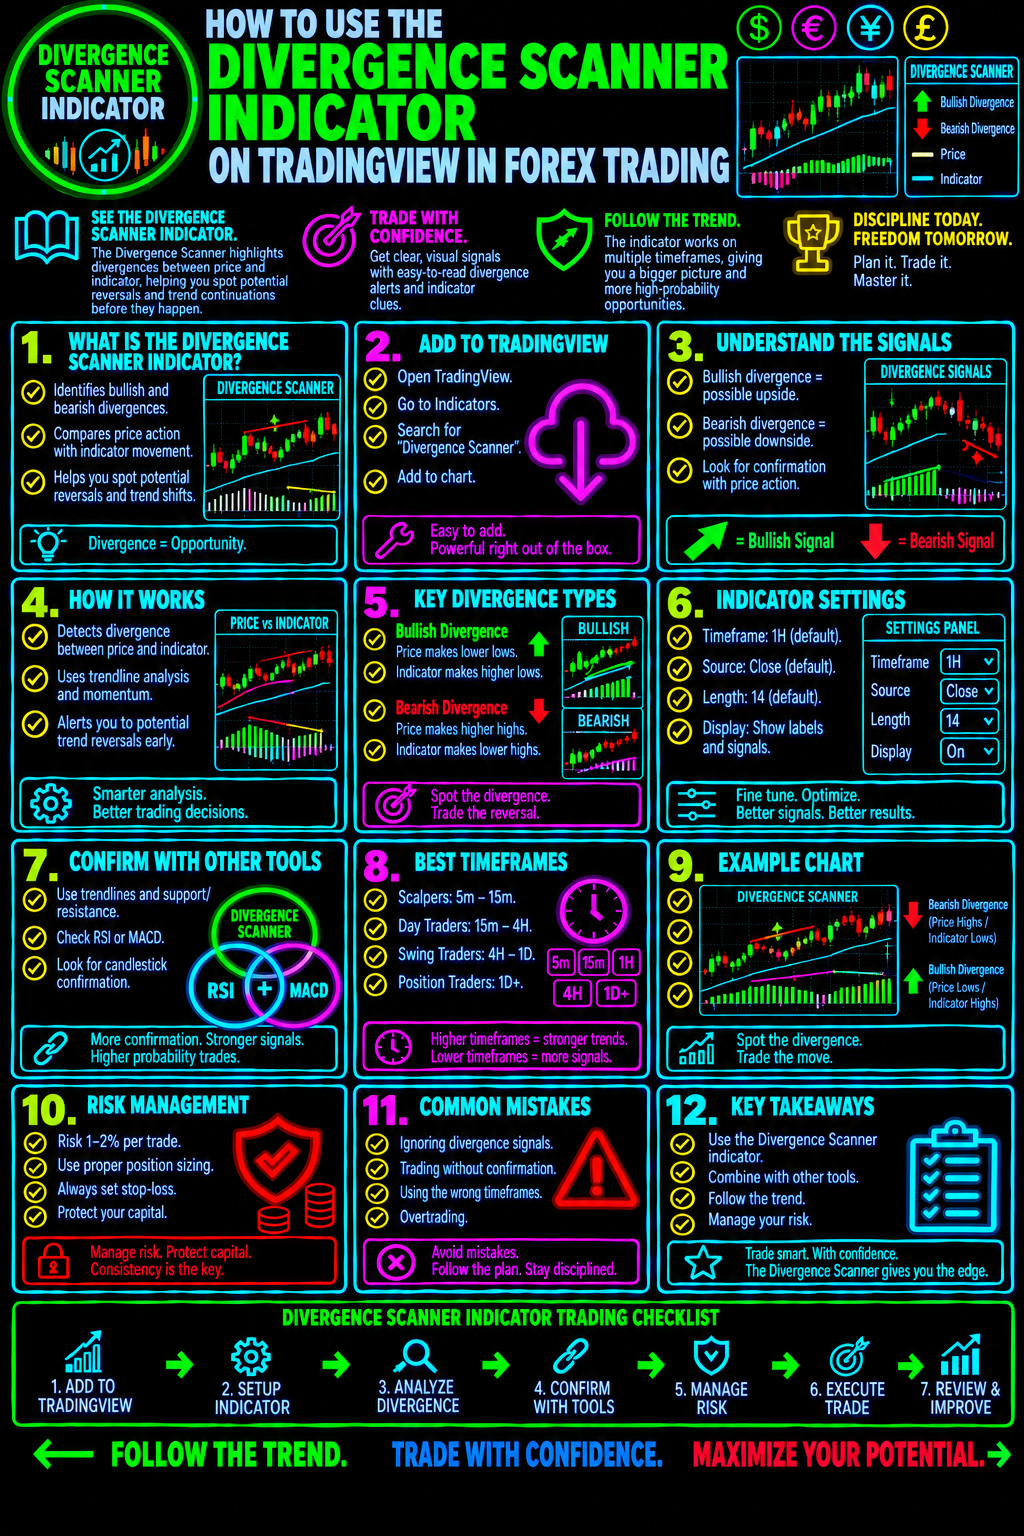
Which Forex Timeframe Should You Use?
The best timeframe depends on your trading style, available time, and the rules of your strategy.
Scalping: Shorter timeframes can produce frequent divergence signals, but market noise, spreads, and transaction costs can make execution more difficult.
Day trading: Intraday charts may help identify developing setups while allowing you to use a higher timeframe for directional context.
Swing trading: Four-hour and daily charts can help traders focus on broader momentum changes and potentially more substantial price movements, although signals may take longer to develop.
A useful approach is to identify the broader trend on a higher timeframe and refine your entry on a lower timeframe. This method requires clear rules to avoid conflicting signals and excessive trading.
Do not assume that a signal is more reliable simply because it appears on a particular timeframe. Test the indicator using the currency pairs, settings, and trading conditions relevant to your strategy.
A Practical Forex Divergence Trading Example
Consider a hypothetical EURUSD chart in which price declines toward a previously identified support area.
The Divergence Scanner identifies a potential regular bullish divergence:
- Price establishes a lower swing low.
- The momentum indicator establishes a higher swing low.
- The signal appears near the support area.
- Price subsequently forms a bullish reversal candle and breaks a nearby minor swing high.
A trader following a predefined strategy might evaluate a long entry after the confirmation, place a stop-loss at a level that invalidates the setup, and identify a potential target near the next resistance zone.
Before entering, the trader calculates position size according to the distance to the stop-loss and the amount of capital allocated to the trade.
If price fails to confirm the reversal, the trader waits rather than forcing an entry.
Now consider the opposite scenario. EURUSD rallies toward resistance while price forms a higher high and the momentum indicator forms a lower high. If price then breaks a relevant swing low, a trader following a bearish divergence strategy might evaluate a short setup.
These are illustrative scenarios, not live trade signals or predictions. Their purpose is to demonstrate how divergence can become one component of a structured trading decision.
Common Divergence Scanner Trading Mistakes
Even a useful technical indicator can produce poor trading decisions when it is used incorrectly.
Trading Every Signal
Not every divergence leads to a reversal. Some signals develop during strong trends that continue for much longer than expected.
Improve your process: Require market-context and price-action confirmation before entering.
Ignoring the Primary Trend
Countertrend trades can be difficult because a market with strong directional momentum may continue despite repeated divergence signals.
Improve your process: Determine the higher-timeframe trend and understand whether your strategy trades reversals, pullbacks, or trend continuation.
Entering Before Confirmation
A developing divergence may appear attractive before price actually changes direction.
Improve your process: Define a specific entry trigger and wait until your criteria are met.
Using Too Many Indicators
Adding several indicators that measure nearly identical conditions can create the illusion of confirmation without providing genuinely independent evidence.
Improve your process: Assign each tool a clear purpose, such as trend identification, momentum assessment, entry confirmation, or risk management.
Ignoring Risk Management
A technically attractive signal can still result in a losing trade.
Improve your process: Calculate position size, define your stop-loss, and determine your maximum acceptable risk before entering.
Trusting Historical Signals Without Testing
Some scripts may use pivot-based calculations that require future candles to confirm a historical swing. This can make a plotted signal appear later than the original turning point. Depending on the implementation, historical displays may differ from what was visible in real time.
Improve your process: Read the script documentation, test alerts in real-time or replay conditions, and check whether signals repaint or change after subsequent candles.
How to Backtest a Divergence Scanner Strategy
Before using real money, evaluate whether your approach has a measurable edge.
Start by documenting the exact rules for your strategy.
- Select the currency pairs and timeframes you intend to trade.
- Define which divergence types qualify for consideration.
- Specify the trend, support, resistance, and price-action conditions required for entry.
- Establish your stop-loss, profit target, and position-sizing rules.
- Record every qualifying setup, including losing trades and trades that never trigger an entry.
- Measure the results across different market conditions.
- Repeat the process in a demo account or through forward testing.
Track your win rate, average winning trade, average losing trade, reward-to-risk ratio, maximum drawdown, and performance after spreads and other trading costs.
A strategy with a high win rate is not automatically profitable. What matters is the relationship between the size of your wins, the size of your losses, and the frequency of each outcome.
Avoid optimizing settings exclusively for past results. Excessive curve fitting can produce impressive historical performance that does not hold up in live markets.
Build a Complete Forex Trading System with Forex Trading Unlocked
A Divergence Scanner can help you identify potential changes in momentum. But profitable trading requires a process that extends beyond a single indicator.
At Forex Trading Unlocked, our educational resources help traders strengthen the skills needed to analyze markets, recognize price-action patterns, manage capital, and develop a repeatable trading plan.
Continue building your technical analysis skills with these resources:
High-Probability Japanese Candlestick Patterns
Learn how to recognize candlestick formations and evaluate them in the context of market structure.
https://www.forex-trading-unlocked.com/High-Probability-Japanese-Candlestick-Patterns.html
Forex Trading Education
Explore our forex trading lessons to strengthen your understanding of technical analysis, market direction, trading setups, and disciplined execution.
https://www.forex-trading-unlocked.com/Forex-Trading.html
Risk Management
Learn why position sizing, stop-loss placement, and capital preservation belong at the center of every trading strategy. A good entry cannot compensate for consistently poor risk management.
TradingView Indicators
Continue exploring technical analysis tools that can help you evaluate trends, momentum, volatility, and potential entry opportunities. Use each indicator as part of a defined strategy rather than as an isolated buy or sell signal.
Take the next step toward a more structured trading approach with our free Forex Trading Starter Kit. Use it to reinforce your trading foundations and develop a plan for improving your analysis.
Visit Forex Trading Unlocked to find the educational resources that match your current trading goals.
Frequently Asked Questions About the Divergence Scanner Indicator
What does a Divergence Scanner Indicator do?
A Divergence Scanner identifies potential differences between price action and a momentum indicator. Depending on the script, it may display regular divergence, hidden divergence, alerts, or signals across selected charts.
Is the Divergence Scanner Indicator good for forex trading?
It can be useful for identifying potential momentum shifts and organizing technical analysis. Its value depends on the specific script, market conditions, and how it fits into a tested trading strategy.
Does bullish divergence mean I should buy?
No. Bullish divergence indicates that downside momentum may be weakening, but price can continue falling. Traders often look for additional evidence, such as support holding or a bullish break of market structure, before considering an entry.
Does bullish divergence mean I should buy?
No. Bullish divergence indicates that downside momentum may be weakening, but price can continue falling. Traders often look for additional evidence, such as support holding or a bullish break of market structure, before considering an entry.Does bearish divergence mean I should sell?
No. Bearish divergence can indicate weakening upside momentum, but it does not guarantee a decline. A trader should evaluate the broader trend, relevant price levels, confirmation signals, and risk before deciding whether to enter.
Can I use divergence for scalping and day trading?
Yes, depending on the indicator's design and your trading rules. Shorter timeframes may generate more frequent signals and more market noise. Spreads, execution, and transaction costs are especially important when trading frequently.
Can divergence signals repaint?
Some divergence scripts use pivot-based calculations that need subsequent candles to confirm a swing high or swing low. Such scripts may plot signals retrospectively or change their displays as new data arrives. Check the specific script's documentation and test its behavior before relying on its alerts.
Which indicator works best with a Divergence Scanner?
RSI, MACD, moving averages, and support-and-resistance analysis can provide complementary information. The best combination is one that serves a clear purpose and demonstrates value through testing, rather than simply adding more signals.
Is the Divergence Scanner Indicator profitable on its own?
No indicator guarantees profitability. Results depend on market conditions, execution, transaction costs, risk management, and the effectiveness of the overall strategy. Test the rules before committing capital.
Final Thoughts: Turn Divergence Signals into Better Trading Decisions
The Divergence Scanner Indicator on TradingView can help forex traders identify potential changes in momentum and locate chart patterns that deserve closer attention.
However, the real advantage comes from knowing what to do after a signal appears.
Identify the trend. Mark support and resistance. Evaluate the divergence. Wait for your predefined confirmation. Calculate the risk. Then follow your trading plan.
Do not chase signals. Build a system.
Continue exploring Forex Trading Unlocked to strengthen your technical analysis, master high-probability candlestick patterns, and develop a disciplined approach to forex trading.
Start with our forex trading education and free Forex Trading Starter Kit, and take the next step toward making more informed trading decisions.
Risk Disclaimer: Forex trading involves substantial risk and is not suitable for every investor. Technical indicators can produce false signals, and past performance does not guarantee future results. This material is for educational purposes only and is not financial or investment advice.
👉 “Get Instant Access (Check Your Email)”
💥 IMPORTANT: One Last Step Required
After you enter your email, check your inbox (or spam folder) for a confirmation email.
👉 Click the confirmation link so I can send you your free Forex training.
⚠️ If you don’t confirm, I can’t send you anything.
👉 “⚠️ Access expires if not confirmed within 24 hours minutes.”
👉 “Takes 10 seconds. Instant access after email confirmation.”