How To Use The Elliott Wave Forecaster Indicator On TradingView In Forex Trading
Forecast Potential Forex Market Moves With The Elliott Wave Forecaster Indicator
What if you could better understand where the Forex market may be heading before committing your capital to a trade?
Forex traders constantly search for ways to identify developing trends, anticipate potential turning points, and recognize opportunities before the crowd. The Elliott Wave Forecaster Indicator on TradingView can help traders analyze potential Elliott Wave structures and evaluate possible future price movements.
Elliott Wave Theory is based on the principle that financial markets often move in recurring patterns driven by collective investor psychology. These patterns can provide a framework for analyzing market trends, corrective moves, and potential price reversals.
When combined with disciplined technical analysis, support and resistance, momentum indicators, and sound risk management, an Elliott Wave forecasting tool can become a valuable part of your Forex trading strategy.
At Forex Trading Unlocked, our objective is simple: help you develop a more structured approach to analyzing currency markets, identifying high-probability trading opportunities, and managing risk.
The goal is not to predict every market move. It is to prepare for potential market scenarios and execute your trading plan with discipline.
What Is The Elliott Wave Forecaster Indicator?
The Elliott Wave Forecaster Indicator is a TradingView charting tool intended to assist traders with analyzing potential Elliott Wave patterns and projecting possible market movements.
Elliott Wave analysis traditionally divides market price action into two major types of movement:
- Impulse waves: Movements that generally progress in the direction of the prevailing trend.
- Corrective waves: Movements that temporarily retrace or consolidate against the prevailing trend.
In a traditional Elliott Wave structure, a bullish impulse sequence consists of five waves, followed by a three-wave correction. Bearish structures follow the same general framework in the opposite direction.
The Elliott Wave Forecaster Indicator can be used as an aid when studying potential wave structures, market direction, and developing price patterns. Its exact calculations, plotted projections, and available settings depend on the specific TradingView script you select.
Remember that wave counts are interpretive. Multiple wave structures can sometimes fit the same price action, and projected movements are scenarios rather than guarantees.
Why Use Elliott Wave Analysis In Forex Trading?
The Forex market moves through periods of trending price action, retracements, consolidation, and volatility. Recognizing these phases can help traders avoid treating every price movement as a trading opportunity.
Elliott Wave analysis offers a framework for organizing that price action.1. Identify Potential Trend Continuations
Impulse waves can help traders evaluate whether a currency pair is developing a sustained directional move.
For example, during an established EURUSD uptrend, a trader may look for a corrective pullback followed by renewed bullish momentum. If the price action supports the analysis, that pullback may offer a potential continuation setup.
2. Recognize Potential Market Reversals
Late-stage wave structures can alert traders to the possibility that a trend is losing momentum or approaching a significant turning point.
However, a potential fifth wave completion does not automatically mean a reversal will occur. Confirmation from price action, momentum, or a break of relevant support or resistance can strengthen the trading case.
3. Develop More Structured Trade Plans
Rather than entering a trade simply because the market appears overbought or oversold, you can build a scenario around the prevailing trend, the potential wave structure, and a clearly defined invalidation level.
This makes it easier to determine where a trade idea is no longer valid and where risk should be controlled.
4. Combine Market Structure With Other Indicators
Elliott Wave analysis can be combined with tools such as moving averages, RSI, MACD, Fibonacci retracements, and support and resistance.
The objective is not to collect as many indicators as possible. It is to find independent evidence that supports or challenges a potential trading opportunity.
How To Find The Elliott Wave Forecaster Indicator On TradingView
TradingView offers a large collection of community-created indicators, and similarly named scripts may use different calculations or forecasting methods.
Follow these steps to locate the indicator you intend to use.
- Open TradingView and select a Forex chart.
- Choose a currency pair such as EURUSD, GBPUSD, or USDJPY.
- Open the Indicators menu.
- Search for Elliott Wave Forecaster.
- Review the available scripts and select the intended indicator.
- Add the indicator to your chart.
- Examine its displayed wave labels, projections, and available settings.
Before relying on the indicator, review the script description and documentation. Confirm what its signals represent, whether its wave labels can change as new price data arrives, and whether it provides projected price levels or other specific features.
Do not assume that every script with a similar name works identically.
How To Use The Elliott Wave Forecaster Indicator Step By Step
Adding an indicator to your chart is easy. Using it as part of a disciplined trading strategy requires a more systematic approach.
Step 1: Identify The Major Market Trend
Start by examining the currency pair's broader price structure.
Look for higher highs and higher lows in an uptrend or lower highs and lower lows in a downtrend. Moving averages and higher-timeframe support and resistance can provide additional context.
For example, if EURUSD is forming higher swing highs and higher swing lows on the four-hour chart, you may prioritize potential bullish continuation setups rather than immediately searching for short positions.
This does not eliminate the possibility of a reversal. It establishes a directional framework for your analysis.
Step 2: Examine The Potential Elliott Wave Structure
Apply the Elliott Wave Forecaster Indicator and examine how its displayed information relates to recent price action.
Ask yourself:
- Does the proposed wave structure fit the broader market trend?
- Is price potentially progressing through an impulse sequence?
- Could the market be undergoing a corrective phase?
- Are important swing highs and lows consistent with the proposed interpretation?
- What price movement would invalidate the current scenario?
Avoid forcing every chart into a perfect wave pattern. When the structure is unclear, remaining on the sidelines may be the better decision.
Step 3: Identify Potential Corrective Pullbacks
Corrective moves can offer opportunities to enter an established trend at a more favorable price.
Suppose GBPUSD is trending higher and begins retracing toward a previous support zone. If the Elliott Wave analysis suggests a potential corrective phase, you can monitor the area for evidence that buying pressure is returning.
Possible confirmation signals include:
- A bullish reversal candlestick near support.
- A break above a short-term swing high.
- Renewed momentum in the direction of the prevailing trend.
- A successful retest of a broken resistance level.
No single confirmation signal guarantees a successful trade. The strongest setups are those in which the entry, invalidation level, and potential reward are clearly defined before placing an order.
Step 4: Evaluate Potential Price Projections
If your selected indicator displays forecast levels or projected wave paths, treat them as analytical reference points rather than certain destinations.
Compare those projections with existing chart structure, including previous swing highs, swing lows, and important support and resistance zones.
Fibonacci extensions may also provide useful reference levels when they are consistent with the broader analysis.
The important question is not simply whether price might reach a projected level. It is whether the potential reward justifies the risk required to participate in the trade.
Step 5: Wait For Price Confirmation
Forecasting a possible move and confirming a trading entry are two different tasks.
A projected bullish wave does not mean you must buy immediately. You can wait for price to break a relevant resistance level, establish a higher low, or demonstrate renewed buying momentum.
Similarly, a bearish projection should not automatically trigger a short position.
Let the forecast guide your preparation. Let price action help determine whether the trade is ready.
Step 6: Establish Your Stop-Loss And Profit Targets
Before entering a trade, define the level at which your analysis would be invalidated.
A stop-loss may be placed beyond a relevant swing point or structural level, depending on the strategy and current market conditions. Your position size should then be calculated according to the distance to that stop and the amount of capital you are prepared to risk.
Potential profit targets can be based on nearby support or resistance, projected wave levels, or a predefined risk-to-reward objective.
Never widen a stop-loss simply because the indicator continues to display a favorable forecast.
Step 7: Review The Trade After Completion
Record the original wave interpretation, entry signal, stop-loss, target, and final result.
Over time, this journal can help you determine which market conditions are most compatible with your approach to Elliott Wave analysis.
Evaluate a meaningful sample of trades rather than judging the indicator on a handful of wins or losses.
Elliott Wave Forecaster Forex Trading Strategy
The following framework illustrates how you might combine wave analysis with trend direction and price-action confirmation.The Trend, Correction, And Confirmation Method
Step 1 — Establish directional bias.
Use the four-hour or daily chart to identify the prevailing trend and important market structure.
Step 2 — Examine the wave scenario.
Use the Elliott Wave Forecaster Indicator to help assess whether price may be developing an impulse or corrective structure.
Step 3 — Mark a potential trading zone.
Identify a relevant support or resistance level where the proposed wave scenario would make technical sense.
Step 4 — Wait for confirmation.
Move to a lower timeframe, such as the one-hour or 15-minute chart, if appropriate for your trading style. Look for a defined price-action trigger rather than entering solely on a forecast.
Step 5 — Calculate risk before entry.
Set the stop-loss, determine your position size, and identify a realistic profit target.
Step 6 — Manage the trade according to your plan.
Do not abandon your rules because a projected wave appears attractive. Exit or manage the position according to your predetermined conditions.
This framework is a starting point for testing, not a guarantee of profitability. Different currency pairs, timeframes, spreads, and market environments can produce different results.
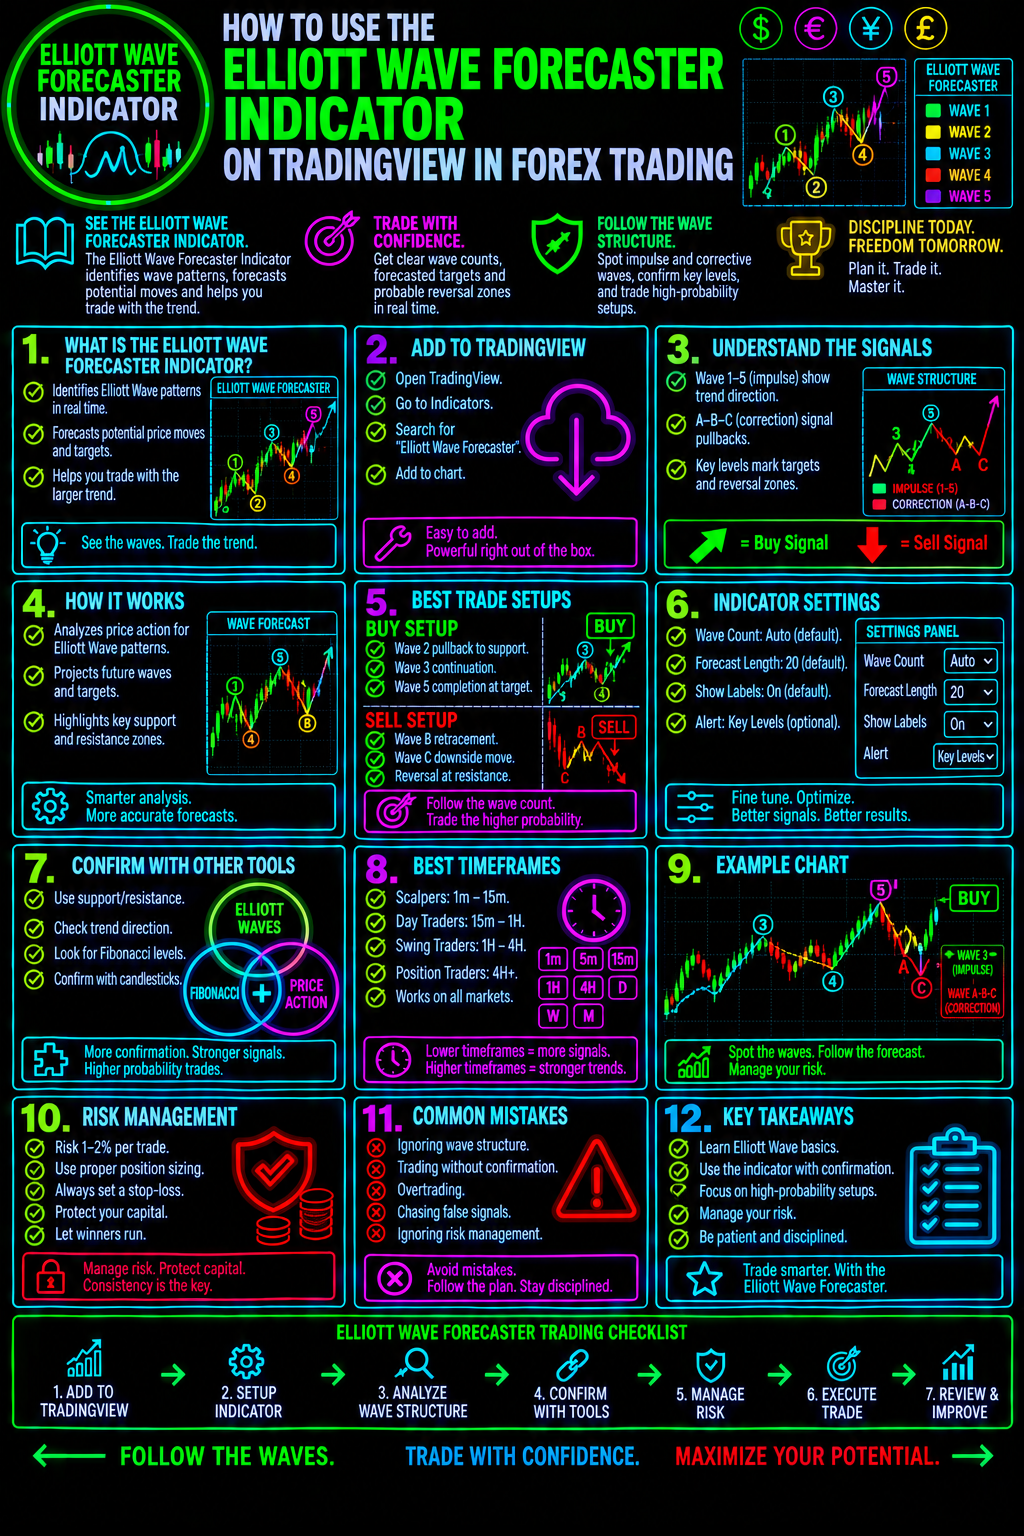
Example: Using Elliott Wave Analysis On EURUSD
Imagine that EURUSD is trading in a broader uptrend.
The Elliott Wave Forecaster Indicator suggests that price may be completing a corrective phase. At the same time, price is approaching a previous support area.
Instead of buying immediately, you wait for additional evidence.
Price forms a bullish reversal candle and then breaks above a short-term swing high. You now have a possible entry trigger that aligns with your original scenario.
Before entering, you identify the price level that would invalidate the bullish setup. You calculate your position size based on the distance to your stop-loss and select a profit target near a meaningful resistance level.
If the market confirms the scenario, the trade may develop as anticipated. If the price breaks below the invalidation level, the analysis has failed and the predetermined risk controls become essential.
The key lesson is that the Elliott Wave forecast helps you build a scenario. Price action, risk management, and execution rules determine how you act on it.
Best Timeframes For The Elliott Wave Forecaster Indicator
Elliott Wave analysis can be applied to multiple timeframes, but the best choice depends on your trading style and the amount of market noise you are prepared to handle.
Daily chart: Useful for examining broader trends, major corrective phases, and longer-term market structure.
Four-hour chart: Useful for swing traders seeking potential trend continuation or reversal setups.
One-hour chart: Useful for traders looking for more frequent opportunities while retaining some broader market context.
15-minute chart: Useful for shorter-term entry analysis, although price noise and transaction costs can have a greater impact.
One practical approach is to identify the broader structure on the daily or four-hour chart and then use a lower timeframe to refine entries.
Remember that a wave pattern on a lower timeframe does not necessarily override the broader trend. Always consider the relationship between timeframes.
How To Combine Elliott Wave Analysis With Other TradingView Indicators
An Elliott Wave forecasting tool can be more useful when its interpretation is compared with other forms of technical evidence.Elliott Wave Forecaster + RSI
The Relative Strength Index can help evaluate momentum and potential overbought or oversold conditions.
If a possible late-stage bullish wave coincides with weakening momentum, you may have a reason to monitor the market for a potential reversal. However, RSI divergence alone does not confirm that a trend has ended.
Learn more in our RSI Forex Trading Guide.Elliott Wave Forecaster + MACD
MACD can help assess changes in momentum and potential shifts in directional pressure.
A bullish wave scenario accompanied by improving MACD momentum may strengthen the case for monitoring a potential long entry. A bearish scenario accompanied by weakening momentum may provide additional context for a short setup.
Explore our MACD Forex Trading Resources to learn more about using momentum analysis in your trading decisions.Elliott Wave Forecaster + Fibonacci Retracements
Fibonacci retracements can help identify potential pullback zones during a developing trend.
When a retracement level aligns with a meaningful swing point, support or resistance, and a plausible corrective wave, the area may deserve closer attention.
A Fibonacci level does not prove that a wave count is correct. It provides another reference point for evaluating the setup.Elliott Wave Forecaster + Support And Resistance
Previous swing highs and lows can provide important context for evaluating projected wave movements.
A bullish projection approaching established resistance may indicate a potential area for profit-taking or reassessment. A corrective decline reaching previous support may be worth monitoring for evidence of trend continuation.
Learn how to incorporate these levels into your analysis with our Forex Support And Resistance Trading Guide.
Common Elliott Wave Forecaster Trading Mistakes
Even an advanced forecasting indicator cannot eliminate uncertainty from the Forex market.
Avoid these common mistakes.
1. Treating projections as guaranteed predictions.
Market conditions change, and new price action can invalidate an otherwise plausible wave scenario.
2. Forcing wave counts onto the chart.
If the structure is ambiguous, do not invent a wave interpretation simply to justify entering a trade.
3. Ignoring the broader trend.
A potential reversal on a short timeframe may be only a minor correction within a much larger directional move.
4. Entering before confirmation.
An anticipated wave completion is not the same as a confirmed change in price direction.
5. Using excessive leverage.
A correct market forecast can still produce a losing trade if the position is too large or the stop-loss is poorly planned.
6. Ignoring economic news.
Interest-rate decisions, inflation reports, employment data, and central-bank announcements can cause sharp price movements that disrupt technical setups.
7. Assuming every indicator is non-repainting.
Some indicators revise historical labels or projections as new data becomes available. Review the script documentation and test its behavior before relying on its signals.
8. Failing to test the strategy.
Backtest where appropriate, account for spreads and execution costs, and forward-test the approach before committing significant capital.
Is The Elliott Wave Forecaster Indicator Good For Beginners?
The indicator may help beginners organize price action and learn how traders interpret potential impulse and corrective structures.
However, Elliott Wave analysis has a learning curve. Beginners should first understand market trends, swing highs and lows, support and resistance, and basic risk management.
Start with one currency pair and a higher timeframe. Practice identifying potential structures without placing live trades. Record your interpretations and compare them with subsequent price action.
Once you have developed a consistent process, you can begin testing a clearly defined entry and exit strategy in a demo account.
The objective is to learn how to evaluate a forecast, not to follow every signal without question.
How To Improve Your Forex Trading With Forex Trading Unlocked
The Elliott Wave Forecaster Indicator is one tool within a much larger trading process.
To build a stronger foundation, combine your chart analysis with structured education, disciplined risk management, and a repeatable trading plan.
At Forex Trading Unlocked, we provide educational resources designed to help traders understand Forex market behavior, recognize technical setups, and improve their decision-making.
Start with these resources:
- Forex Trading Guide — Build a foundation in Forex markets, currency pairs, and trading concepts.
- High Probability Japanese Candlestick Patterns — Learn how candlestick formations can help you evaluate price action and potential reversals.
- Free High Probability Japanese Candlestick Patterns Guide — Strengthen your understanding of candlestick analysis with a practical educational resource.
- Forex Risk Management Guide — Learn why position sizing, stop-loss planning, and capital preservation matter.
- The Ultimate Chart Patterns Forex Trading Course — Develop your understanding of chart formations and the price structures traders use to evaluate opportunities.
These resources can help you connect market forecasts with price-action confirmation and disciplined execution.
Take Your TradingView Chart Analysis Further
TradingView provides a flexible environment for studying currency pairs, applying technical indicators, and evaluating market scenarios.
The Elliott Wave Forecaster Indicator can help you explore potential wave structures and prepare for possible market developments. Its real value depends on how carefully you interpret its information and how consistently you apply your trading rules.
Do not chase forecasts. Do not assume that a projected move must happen. Instead, identify a scenario, determine what would confirm it, define what would invalidate it, and control your risk before entering the market.
Ready to strengthen your Forex trading skills?
Visit Forex Trading Unlocked to explore our educational resources, trading strategies, candlestick guides, and courses designed to help you approach the Forex market with greater structure and discipline.
Learn the patterns. Understand the risk. Build your trading plan.
Risk Disclaimer: Forex trading involves substantial risk and is not suitable for every investor. You can lose some or all of your invested capital. Technical indicators and forecasting tools do not guarantee future results. This material is for educational purposes only and is not financial or investment advice.
👉 “Get Instant Access (Check Your Email)”
💥 IMPORTANT: One Last Step Required
After you enter your email, check your inbox (or spam folder) for a confirmation email.
👉 Click the confirmation link so I can send you your free Forex training.
⚠️ If you don’t confirm, I can’t send you anything.
👉 “⚠️ Access expires if not confirmed within 24 hours minutes.”
👉 “Takes 10 seconds. Instant access after email confirmation.”