How To Use The KN Smart TP SL Signals Indicator On TradingView In Forex Trading
Stop Guessing Where To Enter, Exit, Take Profit, And Place Your Stop Loss
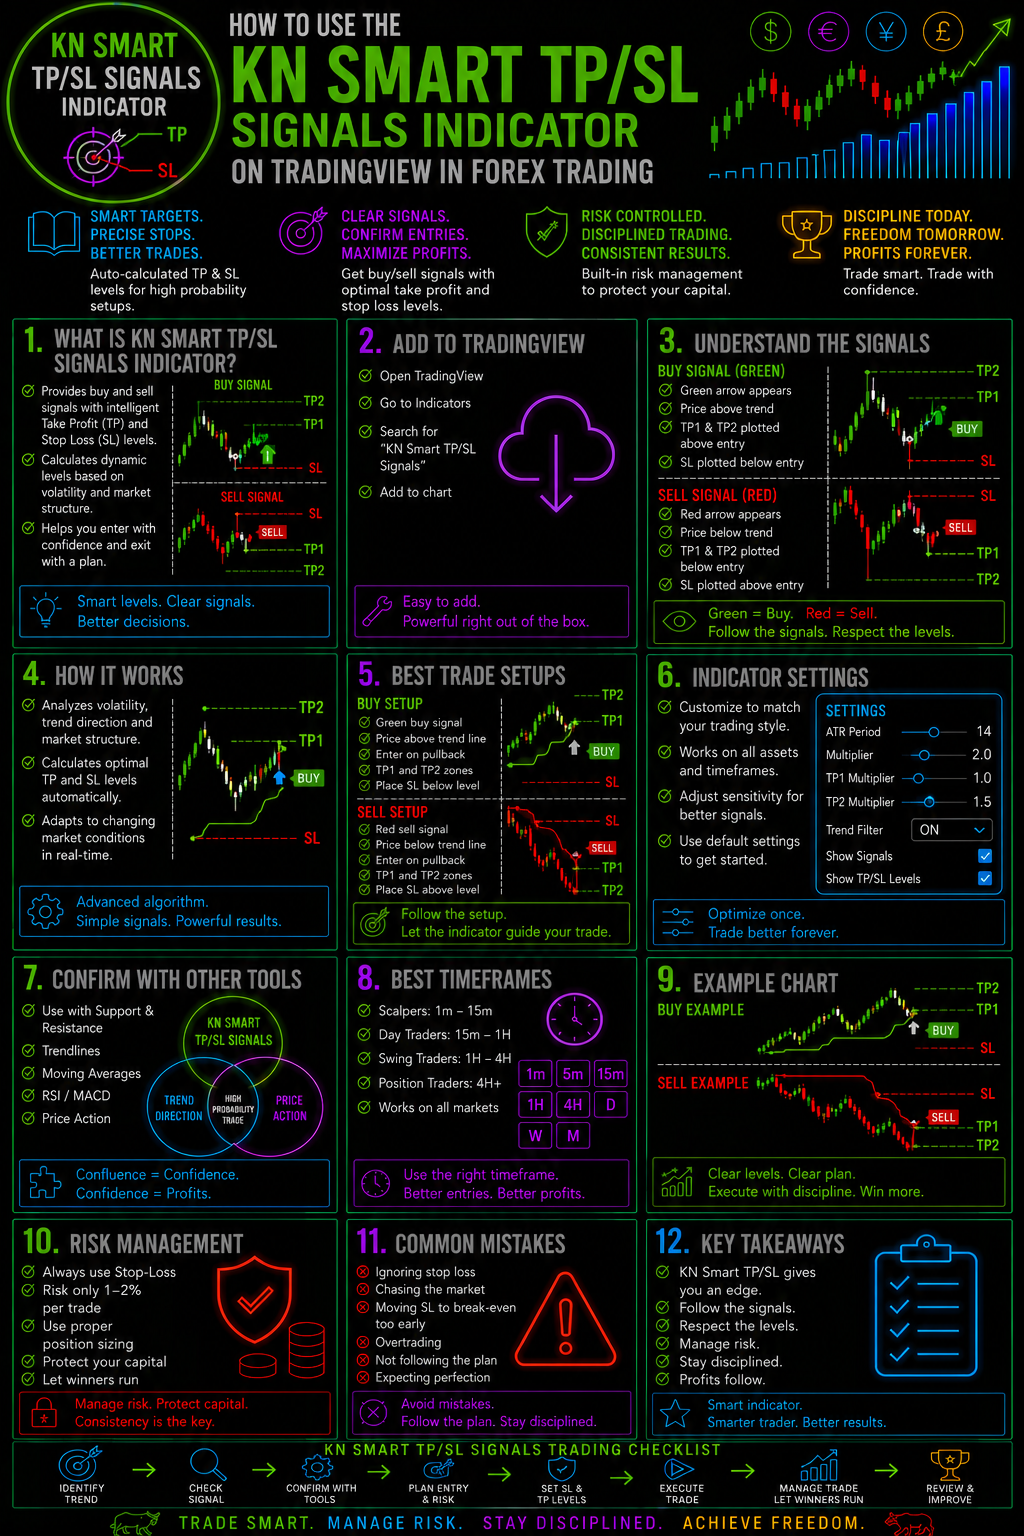
The KN Smart TP SL Signals Indicator on TradingView is designed to help forex traders identify potential trade signals while providing visual guidance for take-profit and stop-loss levels.
But an indicator is only as useful as the trader operating it.
This guide shows you how to read the KN Smart TP SL Signals Indicator, how to interpret its signals, how to use its TP and SL information, and—most importantly—how to combine it with proper forex analysis and risk management.
If you're looking for a cleaner, more structured way to analyze potential forex trades, this is where you start.
What Is The KN Smart TP SL Signals Indicator?
The KN Smart TP SL Signals Indicator is a TradingView indicator designed to provide traders with visual trading signals and potential take-profit (TP) and stop-loss (SL) reference levels.
Instead of looking at price action without any framework, the indicator can help organize the chart around three critical questions:
Where might I enter?
Where might I take profit?
Where should I consider getting out if the trade moves against me?
That makes the indicator particularly interesting for forex traders who want to bring greater structure to their trade analysis.
However, signals should never be treated as automatic guarantees of profitable trades.
The market remains unpredictable.
Your job is to determine whether the signal makes sense within the broader market environment.
Why TP And SL Matter So Much In Forex Trading
Many new traders concentrate almost entirely on finding an entry.
That is a mistake.
A complete trade requires much more than an entry.
Before entering a position, you should already understand:
- Your potential entry
- Your stop-loss location
- Your potential profit target
- Your risk per trade
- Your potential reward relative to your risk
- The market trend
- Nearby support and resistance
- Current volatility
- Whether the setup actually fits your trading strategy
This is where a tool such as the KN Smart TP SL Signals Indicator can become useful.
It gives you a visual framework for thinking about the entire trade, rather than simply searching for an entry signal.
Get The KN Smart TP SL Signals Indicator Now
How To Add The KN Smart TP SL Signals Indicator To TradingView
Getting started is straightforward.
Step 1: Open TradingView
Open your TradingView chart and select the forex market you want to analyze.
Popular pairs include:
Step 2: Open The Indicators Menu
Select Indicators from the TradingView chart interface.
Search for:
KN Smart TP SL Signals
Select the appropriate indicator from the available results.
Step 3: Add It To Your Chart
Once added, the indicator should appear directly on your price chart.
Take some time to understand what each visual component represents before acting on any signal.
Step 4: Adjust The Settings
Depending on the version and available settings, traders may be able to adjust parameters affecting the indicator's signals and presentation.
Do not immediately optimize the settings simply because one setting appears to produce more signals.
More signals do not automatically mean better signals.
How To Read The KN Smart TP SL Signals Indicator
The most important skill isn't adding the indicator.
It's learning how to interpret what you're seeing.
When a potential signal appears, don't immediately click Buy or Sell.
Instead, ask:
1. What Is The Overall Trend?
Is price moving:
Higher?
Lower?
Sideways?
A bullish signal occurring within a strong bullish market may deserve more attention than the same signal appearing against a powerful downtrend.
2. Where Is Price Relative To Support And Resistance?
A signal directly beneath major resistance deserves additional scrutiny.
Likewise, a bearish signal directly above significant support may have limited downside potential.
The surrounding price structure matters.
3. Where Is The Stop Loss?
The stop loss is one of the most important components of the setup.
Don't ask:
"How much can I make?"
Ask:
"How much can I afford to lose if I'm wrong?"
That single change in thinking can dramatically improve trading discipline.
4. Where Is The Take-Profit Target?
A potential trade becomes much more interesting when you can clearly identify both the risk and the potential reward.
5. Does The Trade Make Sense?
The indicator provides information.
You provide the judgment.
KN Smart TP SL Signals: Don't Trade The Signal Alone
This is one of the most important lessons on this page.
An indicator signal is not the same thing as a complete trading strategy.
Markets can produce:
- False breakouts
- Whipsaws
- Sudden reversals
- News-driven volatility
- Low-volume price movement
- Trend changes
- Unexpected liquidity events
That means the best approach is to use the KN Smart TP SL Signals Indicator as one component of a broader trading process.
Consider combining the indicator with:
Price Action
Look at what price itself is doing.
Support & Resistance
Identify important areas where price may react.
Trend Analysis
Determine whether the market is trending or ranging.
Japanese Candlestick Analysis
Look for confirmation through meaningful candle formations.
Multiple Time Frame Analysis
Compare the broader market trend with the timeframe you're using for your trade.
Risk Management
Never allow a single trade to create disproportionate damage to your trading account.
Using Multiple Time Frames With The KN Smart TP SL Indicator
One of the most powerful ways to improve your analysis is to stop viewing a single timeframe in isolation.
For example:Higher Time Frame
Use the daily or 4-hour chart to establish the broader market structure.Trading Time Frame
Move to the 1-hour or 15-minute chart to identify potential setups.Entry Time Frame
If appropriate for your strategy, move down to a lower timeframe to refine the entry.
The objective isn't to find a signal on every timeframe.
The objective is to determine whether the timeframes are telling a reasonably consistent story.
Example Forex Trading Process
Imagine EUR/USD is trending higher.
You notice a bullish KN Smart TP SL signal.
Instead of entering immediately, walk through the following checklist:
1. Is EUR/USD trending higher?
Yes.
2. Is price holding above important support?
Yes.
3. Does the signal agree with the broader trend?
Yes.
4. Is there enough room before major resistance?
Yes.
5. Is the proposed stop-loss logical?
Yes.
6. Is the potential reward sufficient relative to the risk?
Yes.
Now you have something considerably more useful than simply:
"The indicator says BUY."
You have a structured trading hypothesis.
When The KN Smart TP SL Signal Should Make You Wait
Sometimes the best trade is no trade.
Be cautious when:
- Price is moving violently
- Major economic news is approaching
- The market is trapped in a narrow range
- Price is directly beneath major resistance
- Price is sitting directly above major support
- The signal conflicts with the dominant trend
- The potential reward doesn't justify the risk
- The chart structure is unclear
A professional trader doesn't need to participate in every market movement.
Selectivity is a trading advantage.
KN Smart TP SL Indicator And Risk Management
This is where the indicator should fit into a much larger trading framework.
Suppose your account contains $10,000.
You should determine your acceptable risk before entering the trade.
The position size should then be calculated from:
Account Size → Risk Percentage → Stop-Loss Distance → Position Size
Not:
"How many lots can I afford?"
That distinction is critical.
A stop loss isn't simply an exit mechanism.
It is part of your position-sizing system.
How To Avoid The Biggest Indicator Mistake
The biggest mistake traders make with indicators is indicator dependency.
They see a signal and assume the market must move in the indicated direction.
That's not how trading works.
Indicators analyze historical price information and generate calculations based upon defined rules.
They don't know what will happen next.
Instead, use the KN Smart TP SL Signals Indicator to help answer questions such as:
Is there a potential setup?
Where could the trade become invalid?
Where might profit targets be located?
Does this setup fit my broader trading plan?
That's a much more powerful way to use an indicator.
KN Smart TP SL Signals Indicator Trading Checklist
Before entering a trade, run through this checklist:
- Identify the dominant market trend.
- Confirm the KN Smart TP SL signal.
- Check nearby support and resistance.
- Examine price action.
- Look for candlestick confirmation.
- Identify the potential stop-loss level.
- Identify the potential take-profit level.
- Calculate your risk-to-reward relationship.
- Determine the correct position size.
- Check for major economic news.
- Decide whether the setup actually meets your trading rules.
If the trade doesn't meet your rules, don't force it.
The KN Smart TP SL Indicator Is A Tool—Your Trading Plan Is The System
This distinction is critical.
The indicator can help organize information.
Your trading plan determines what you actually do with that information.
The strongest approach is to build a repeatable process around:
Market Analysis → Signal → Confirmation → Risk → Execution → Management → Review
That's how you move away from random trades and toward a disciplined trading process.
Take Your Forex Analysis Further
If you're learning how to use the KN Smart TP SL Signals Indicator, don't stop here.
The real advantage comes from understanding why price moves and how different technical tools can work together.
Continue your education with our related Forex Trading Unlocked resources:Learn Forex Trading
Build your foundation with our guides covering forex markets, currency pairs, leverage, pips, trading sessions and more.
→ Explore The Forex Trading Education HubMaster Japanese Candlesticks
Candlesticks provide valuable information about market psychology, momentum and potential reversals.
→ Learn High-Probability Japanese Candlestick PatternsLearn Support & Resistance
Understanding where buyers and sellers may enter the market can dramatically improve how you interpret indicator signals.
→ Master Forex Support & ResistanceLearn Multiple Time Frame Analysis
Stop looking at one chart in isolation.
→ Learn The Forex Multiple Time Frame StrategyMaster Forex Risk Management
A great entry doesn't matter if your risk management is poor.
→ Read The Complete Forex Risk Management Guide
Want More Than An Indicator?
This is where Forex Trading Unlocked can take your trading education further.
The goal isn't to give you another collection of random indicators.
The goal is to help you develop a repeatable trading process.
Learn how to combine:
Technical Analysis
Price Action
Japanese Candlesticks
Market Structure
Risk Management
Trade Execution
into a complete approach to forex trading.Don't Just Collect Indicators.Learn How To Trade The Market.
→ Explore Forex Trading Unlocked
Frequently Asked Questions
What is the KN Smart TP SL Signals Indicator?
The KN Smart TP SL Signals Indicator is a TradingView tool designed to provide visual trading signals along with potential take-profit and stop-loss information.
Is the KN Smart TP SL Signals Indicator profitable?
No indicator can guarantee profitable trades. Its signals should be evaluated alongside market structure, trend, price action, risk management and your overall trading strategy.
Can beginners use the KN Smart TP SL Signals Indicator?
Yes, but beginners should first understand basic forex concepts, position sizing, stop losses, risk management and technical analysis.
What is the best timeframe for the KN Smart TP SL Signals Indicator?
There is no universally best timeframe. The appropriate timeframe depends on your trading strategy, objectives, risk tolerance and trading style.
Should I use the indicator by itself?
It is generally better to use an indicator as part of a complete trading process rather than treating individual signals as automatic buy or sell instructions.
Does the indicator work for all forex pairs?
The indicator may be applied to different forex pairs, but market behavior varies significantly between currency pairs and market conditions. Traders should test any approach before risking real capital.
Final Thoughts
The KN Smart TP SL Signals Indicator can give forex traders another way to organize their charts around potential entries, take-profit levels and stop-loss levels.
But the indicator itself isn't the edge.
The edge comes from how you use it.
Combine the signal with market structure.
Confirm it with price action.
Respect support and resistance.
Control your position size.
Define your risk before entering.
And never confuse an indicator signal with certainty.
The market doesn't owe you a winning trade.
Your job is to build a process that keeps you in the game long enough to capitalize when the right opportunities appear.
Ready To Go Beyond The Indicator?
Explore Forex Trading Unlocked and start building a more disciplined, structured approach to forex trading.
→ START LEARNING FOREX TRADING NOW
👉 “Get Instant Access (Check Your Email)”
💥 IMPORTANT: One Last Step Required
After you enter your email, check your inbox (or spam folder) for a confirmation email.
👉 Click the confirmation link so I can send you your free Forex training.
⚠️ If you don’t confirm, I can’t send you anything.
👉 “⚠️ Access expires if not confirmed within 24 hours minutes.”
👉 “Takes 10 seconds. Instant access after email confirmation.”