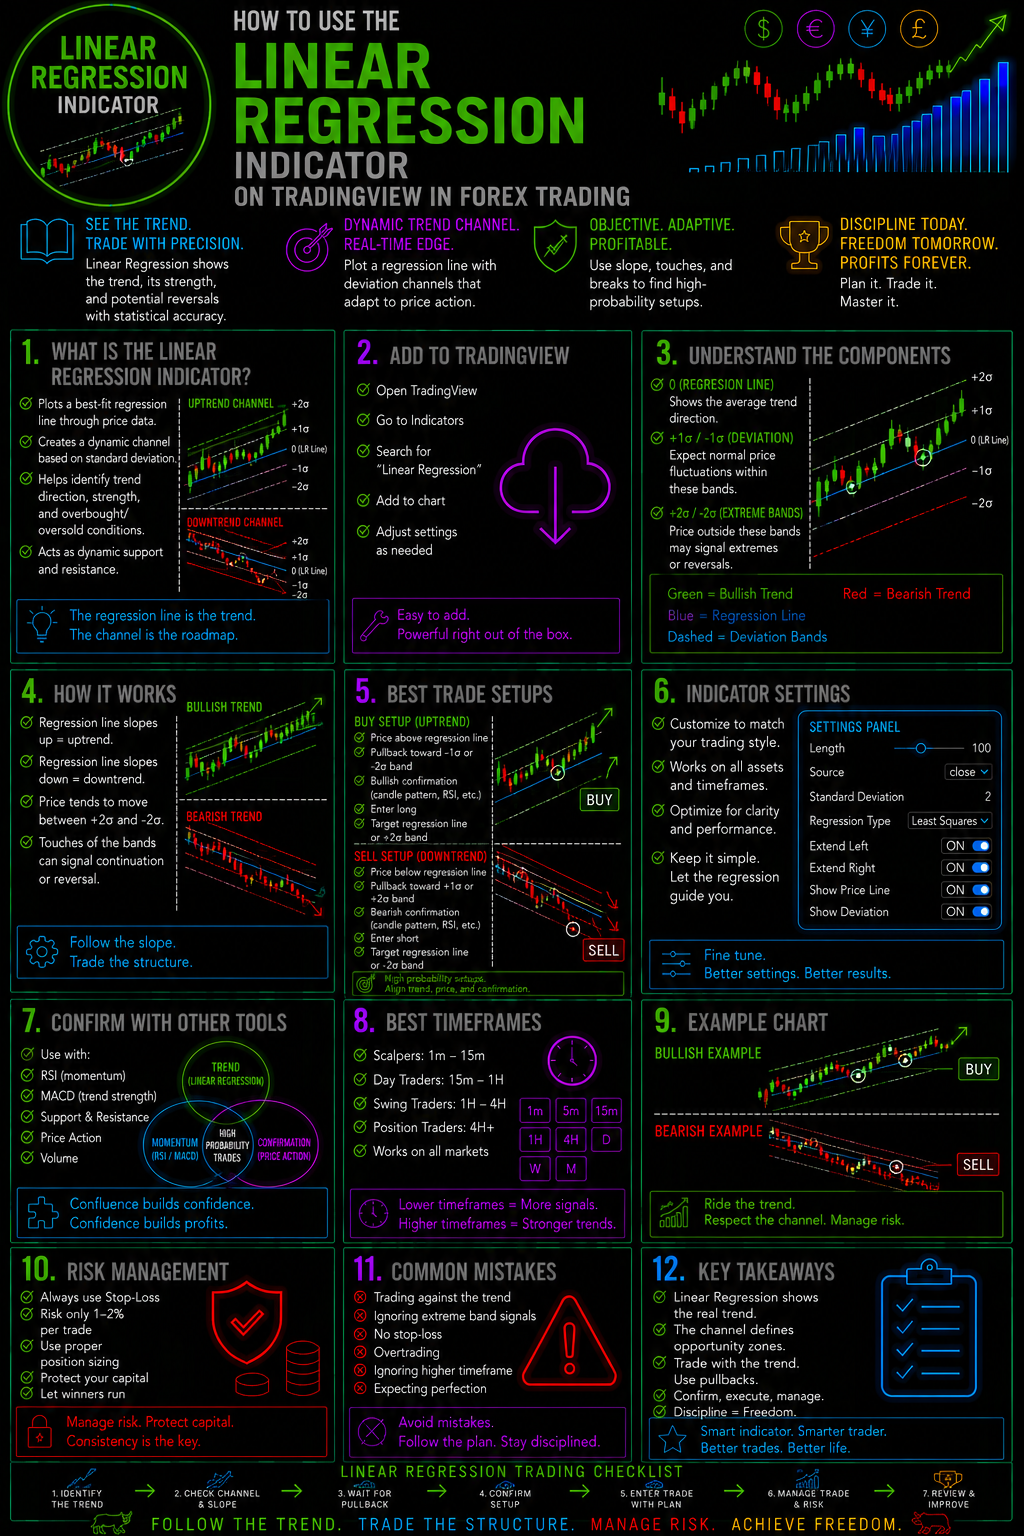
How To Use The Linear Regression Indicator On TradingView In Forex Trading
Learn How To Use Linear Regression To See Forex Trends With Greater Clarity
Forex markets can move fast. Price can reverse, consolidate, break out, and trend before a trader has time to make sense of what is happening.
That is where the Linear Regression Indicator on TradingView can become a valuable addition to your Forex trading toolkit.
Instead of simply looking at where price is now, Linear Regression helps traders analyze the underlying direction of price over a selected period. It can help identify trend direction, measure the strength of a move, recognize potential deviations from the trend, and provide another layer of confirmation before entering a trade.
But there is an important distinction:
Linear Regression is not a magic buy-or-sell signal.
The real advantage comes from understanding what the indicator is telling you and combining that information with price action, support and resistance, momentum, market structure, and disciplined risk management.
In this guide, you'll learn how to use the Linear Regression Indicator on TradingView specifically for Forex trading—and how to turn the information it provides into a more structured trading process.
What Is The Linear Regression Indicator?
Linear Regression is a statistical method used to identify the relationship between variables and establish a best-fit line through a series of price observations.
On a Forex chart, the Linear Regression Indicator attempts to show the general direction of price over a defined lookback period.
Think of it as asking:
"If I smooth out the noise, what direction is price generally moving?"
When price is consistently moving higher, the regression line can slope upward.
When price is consistently moving lower, the regression line can slope downward.
When price is moving sideways, the regression line can become relatively flat.
This makes Linear Regression particularly interesting for traders who want to distinguish between a genuine directional move and short-term price fluctuations.
Why Use Linear Regression In Forex Trading?
One of the biggest challenges in Forex trading is determining the difference between market noise and meaningful direction.
A currency pair may make several bullish and bearish moves during a trading session while still maintaining a larger trend.
Linear Regression can help put those movements into perspective.
Traders can use it to help:
- Identify the prevailing trend
- Determine whether price is generally rising or falling
- Monitor changes in trend direction
- Evaluate price movement relative to a regression line
- Identify potential overextensions
- Confirm information from other indicators
- Improve trend-following decisions
- Create more structured entry and exit rules
The key is not to use Linear Regression in isolation.
Instead, use it as another piece of evidence inside a complete Forex trading strategy.
How To Find Linear Regression On TradingView
TradingView makes it relatively easy to add technical analysis tools to a Forex chart.
Start by opening your preferred currency pair.
For example:
Then select the Indicators or drawing-tool area within TradingView and search for Linear Regression.
Depending on the specific Linear Regression tool or script you select, the appearance and available settings can differ.
That matters.
Not every Linear Regression-based indicator works exactly the same way.
Before using one in live trading, understand what the specific TradingView indicator is calculating, what its settings control, and whether it is designed to provide a regression line, channel, bands, signals, or another variation.
Understanding The Linear Regression Line
The most basic concept is the regression line itself.
The line represents the statistical best fit through the selected price data.
The direction of that line becomes extremely important.Rising Regression Line
A rising regression line generally indicates that price has been trending upward over the selected period.
This can provide bullish trend information.
However, a rising line does not automatically mean:
BUY NOW.
Price could already be significantly extended, approaching resistance, or preparing for a correction.Falling Regression Line
A falling regression line generally indicates that price has been trending downward.
This can provide bearish trend information.
Again, it does not automatically mean:
SELL NOW.
The market could be approaching support or experiencing a temporary pullback inside a larger bullish structure.Flat Regression Line
A relatively flat regression line can indicate that price lacks strong directional movement over the selected period.
This may occur during consolidation or a range-bound market.
For trend traders, this can be an important warning.
Not every market environment is ideal for trend-following.
Linear Regression And Forex Trend Identification
Trend identification is one of the most practical applications of Linear Regression.
Consider a EURUSD chart.
If the regression line is rising and price continues to make higher highs and higher lows, multiple pieces of evidence may be pointing in the same direction.
A trader could then look for bullish setups rather than constantly attempting to predict a reversal.
The opposite applies when the regression line slopes downward while market structure continues producing lower highs and lower lows.
This creates an important trading principle:Trade With The Evidence—Not Against It.
Rather than trying to catch every turning point, traders can use Linear Regression to help establish the market's directional bias before searching for an entry.
Using Linear Regression With Support And Resistance
Linear Regression becomes even more useful when combined with traditional price analysis.
Suppose GBPUSD is trending higher.
The regression line is rising.
Price pulls back toward a major support level.
Instead of immediately selling because price is falling temporarily, a trader can ask:
- Is the larger regression trend still bullish?
- Is price approaching meaningful support?
- Is bullish price action appearing?
- Is momentum beginning to recover?
- Has the market structure remained intact?
If the answers support the bullish scenario, the pullback may represent an opportunity to investigate a continuation trade.
This is much more powerful than treating the indicator as a standalone signal.
Trend + Location + Confirmation = A Better Trading Decision
Linear Regression Channels
Some TradingView Linear Regression tools use a channel surrounding the regression line.
The channel can provide additional information about how far price has moved away from the statistical center of the selected period.
When price approaches the upper portion of a regression channel, traders may begin watching for signs that the market is becoming extended.
When price approaches the lower portion, traders may monitor for potential downside exhaustion.
But remember:
An extreme reading is not automatically a reversal signal.
Strong trends can remain extended much longer than expected.
This is why regression channels should be combined with market structure and price action rather than used as an automatic reversal system.
How To Use Linear Regression For A Bullish Forex Setup
Here is a simple framework traders can test.
Step 1: Establish The Trend
Look at the regression line.
Is it clearly rising?
Step 2: Confirm Market Structure
Look for higher highs and higher lows.
Step 3: Identify A Pullback
Rather than chasing price after a large bullish move, wait for price to retrace.
Step 4: Locate Support
Look for an important support level, moving average, previous breakout zone, or other area where buyers may become active.
Step 5: Look For Confirmation
Use price action or another momentum tool to determine whether buyers are returning.
Step 6: Define Risk
Determine where the trade idea becomes invalid before entering.
Step 7: Establish The Target
Use market structure, resistance, risk/reward considerations, or another predefined exit method.
This process transforms Linear Regression from something you simply watch into something you can incorporate into a repeatable trading framework.
How To Use Linear Regression For A Bearish Forex Setup
The same process can be reversed.
Step 1: Identify A Falling Regression Line
The broader directional bias is bearish.
Step 2: Confirm Lower Highs And Lower Lows
Market structure should support the bearish bias.
Step 3: Wait For A Rally
Instead of chasing price lower, allow the market to retrace upward.
Step 4: Identify Resistance
Look for an area where sellers could potentially return.
Step 5: Wait For Confirmation
Look for bearish price action or additional technical confirmation.
Step 6: Define Your Stop
Know exactly where the bearish trade thesis becomes invalid.
Step 7: Establish Your Profit Objective
Use a predetermined target based on your trading plan.
This creates a critical difference between trading a trend and simply reacting to candles.
Using Multiple Time Frames With Linear Regression
One of the most effective ways to improve your analysis is to stop looking at a single timeframe.
For example:
Daily Chart → Determine the larger trend
4-Hour Chart → Identify the intermediate structure
1-Hour Chart → Search for the setup
15-Minute Chart → Fine-tune the entry
The exact timeframes should match your trading style.
A swing trader may use substantially larger timeframes.
An intraday trader may focus on shorter charts.
The objective is to prevent a short-term movement from misleading you about the larger market environment.
If the Daily and 4-Hour regression trends are bullish while the 15-minute chart is temporarily bearish, that short-term weakness could simply be a pullback.
That changes the question from:
"Is the market bearish?"
to:
"Is this bearish move actually a correction inside a larger bullish trend?"
That is a much better question.
Linear Regression And Momentum
Trend direction alone is not enough.
A market can have a bullish regression slope while momentum is deteriorating.
Likewise, a bearish regression slope can exist while selling pressure is beginning to weaken.
This is why combining Linear Regression with a momentum indicator can provide additional confirmation.
Traders may investigate combinations involving:
- RSI
- MACD
- Stochastic
- Momentum
- Volume-based tools
- Price action
- Market structure
The goal is not to place ten indicators on one chart.
The goal is confluence.
When different analytical methods tell a similar story, the trading decision can become more structured.
Common Linear Regression Trading Mistakes
Mistake #1: Treating The Regression Line As A Buy/Sell Signal
A rising line does not automatically mean buy.
A falling line does not automatically mean sell.
The indicator describes market behavior; it does not eliminate the need for analysis.
Mistake #2: Ignoring Support And Resistance
Price can remain in a strong trend while approaching a major technical barrier.
Always consider where price is trading—not simply which direction the regression line is pointing.
Mistake #3: Trading Every Regression Channel Extreme
Price touching an upper or lower channel does not guarantee a reversal.
Strong trends can remain overextended.
Wait for confirmation.
Mistake #4: Using Too Many Indicators
Adding more indicators does not automatically produce better analysis.
Five indicators telling you the same thing may provide less useful information than two complementary tools used properly.
Mistake #5: Ignoring Risk Management
Even a high-quality setup can fail.
Your position size, stop-loss strategy, risk/reward structure, and maximum acceptable loss must be determined before the trade.
The Linear Regression Forex Trading Checklist
Before entering a trade, ask:
Trend
- What direction is the regression line moving?
- Is the broader market structure supporting that direction?
Location
- Is price near support or resistance?
- Is price extended from the regression line?
Confirmation
- Is price action confirming the setup?
- Is momentum supporting the trade?
Risk
- Where is the trade invalidated?
- How much capital am I risking?
Reward
- Where is my target?
- Does the potential reward justify the risk?
Execution
- What exactly triggers my entry?
- What would make me stay out?
If you cannot answer these questions, you may not have a complete trade setup yet.
Linear Regression Is A Tool—Your Trading System Is The Edge
This is one of the most important concepts for Forex traders to understand.
An indicator does not create a profitable trading system by itself.
The edge comes from the process surrounding the indicator.
That process can include:
Market Environment → Trend → Structure → Location → Confirmation → Entry → Risk → Management → Exit
Linear Regression can contribute valuable information at the trend and structure stages.
But the trader still has to make the decisions.
That is why learning how indicators work is only one part of becoming a more disciplined Forex trader.
Take Your TradingView Analysis Further
If you are learning how to use TradingView indicators, don't stop with Linear Regression.
Forex Trading Unlocked is designed to help traders understand the tools, concepts, strategies, and market relationships that can turn a confusing chart into a structured trading decision.
Continue building your technical analysis skills with our related Forex education:
Explore more TradingView indicators
Learn how other TradingView indicators can be incorporated into your Forex analysis and discover which tools fit your trading style.
Learn Forex Support & Resistance
Understand how major price levels can help you identify potential continuation, reversal, breakout, and trade-management opportunities.
Master Forex Trend Analysis
Learn how to recognize market direction, pullbacks, trend changes, and potential continuation setups.
Study Japanese Candlestick Patterns
Improve your ability to read the price action taking place around your technical levels and indicators.
Learn Forex Risk Management
Because identifying a great-looking setup means very little if you do not know how much to risk.
Ready To Become A More Confident Forex Trader?
Knowing what an indicator does is only the beginning.
The real skill comes from knowing when to use it, when not to use it, what information to combine with it, and how to turn that information into a disciplined trading plan.
That is exactly what serious Forex education should help you accomplish.
Don't chase the next trade. Build the skills to recognize the right setup.
Explore more Forex Trading Unlocked education, strategies, indicators, and trading resources and continue building your Forex trading knowledge.
Frequently Asked Questions
What is the Linear Regression Indicator in Forex trading?
The Linear Regression Indicator is a technical analysis tool that helps identify the general direction of price over a selected period by calculating a best-fit trend through historical price data.
Is Linear Regression a good Forex indicator?
Linear Regression can be useful for identifying trend direction and evaluating price movement, particularly when combined with market structure, support and resistance, price action, and risk management.
Does Linear Regression predict Forex prices?
No. Linear Regression should not be viewed as a guaranteed prediction tool. It analyzes historical price relationships and can help traders evaluate current market direction.
Can Linear Regression be used for scalping?
Yes, traders can use Linear Regression on shorter timeframes, but shorter charts generally contain more market noise. Scalpers should test settings carefully and use strict risk management.
Can Linear Regression be used for swing trading?
Yes. Longer timeframes can make Linear Regression useful for evaluating broader market trends and identifying potential pullbacks within those trends.
Should I use Linear Regression by itself?
Generally, it is better to use Linear Regression as part of a broader trading process rather than relying on it as a standalone buy or sell signal.
What Forex pairs work with Linear Regression?
Linear Regression can be applied to virtually any currency pair available on TradingView. Traders should select pairs and timeframes that fit their strategy and liquidity requirements.
What is the best Linear Regression setting?
There is no universal best setting. The appropriate lookback period depends on the currency pair, timeframe, trading style, and strategy. Traders should backtest and forward-test their settings before risking real capital.
Final Thoughts
The Linear Regression Indicator can give Forex traders another way to look beyond individual candles and focus on the broader direction of price.
Used correctly, it can help answer important questions:
Is the market trending?
Which direction is the trend moving?
Is price pulling back or accelerating?
Is price becoming extended?
Does the current setup agree with the larger market structure?
Those questions are far more valuable than simply asking whether an indicator says "buy" or "sell."
Use Linear Regression as part of a complete trading framework.
Combine it with price action, support and resistance, market structure, momentum, multiple-timeframe analysis, and disciplined risk management.
Then test your rules.
Measure your results.
Refine your process.
And most importantly, remember:
The indicator is not the trader.
The trader's ability to interpret information, manage risk, and execute a repeatable process is what matters.
👉 “Get Instant Access (Check Your Email)”
💥 IMPORTANT: One Last Step Required
After you enter your email, check your inbox (or spam folder) for a confirmation email.
👉 Click the confirmation link so I can send you your free Forex training.
⚠️ If you don’t confirm, I can’t send you anything.
👉 “⚠️ Access expires if not confirmed within 24 hours minutes.”
👉 “Takes 10 seconds. Instant access after email confirmation.”