How To Use The Market Gravity Indicator On TradingView In Forex Trading
Discover How the Market Gravity Indicator Can Help You Analyze Forex Price Movements
What if you could better understand where Forex prices may be drawn, where market momentum could be changing, and where a currency pair might be preparing for its next significant move?
The Market Gravity Indicator on TradingView offers Forex traders another way to study price behavior, identify potential areas of attraction, and evaluate possible trading opportunities. When combined with price action, trend analysis, support and resistance, and sound risk management, it can become a valuable component of a structured Forex trading strategy.
But there is an important distinction: an indicator should never make your trading decisions for you. The real advantage comes from understanding what the indicator displays, how to interpret its signals, and when the market conditions support a potential trade.
At Forex Trading Unlocked, our goal is to help you move beyond blindly following indicators and develop a more disciplined, informed approach to trading the Forex market.
Learn how to evaluate the Market Gravity Indicator, incorporate it into your TradingView charts, and use market structure to make better-informed trading decisions.
What Is the Market Gravity Indicator?
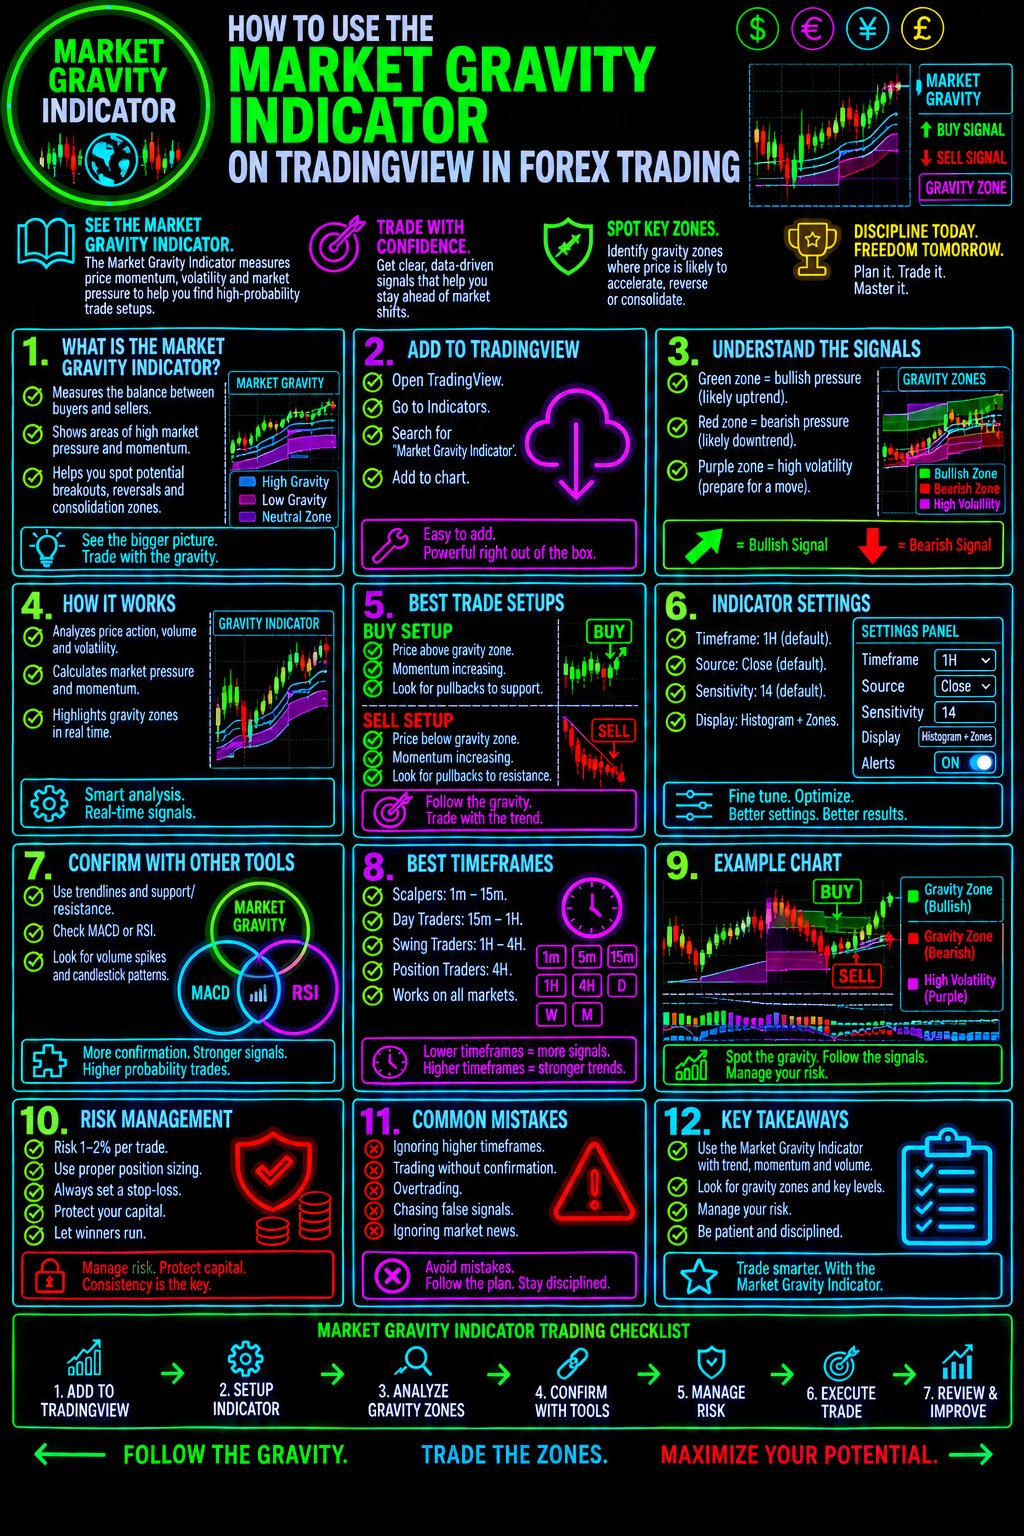
The Market Gravity Indicator is a TradingView indicator designed to help traders analyze potential relationships between price levels and market direction.
The term market gravity suggests the idea that certain price areas may attract price action or influence where the market moves next. Depending on the specific indicator script, its calculations and visual signals may be based on different methods.
It is important to understand that there is no single universal definition of a Market Gravity Indicator. TradingView may offer scripts with similar names but different calculations, settings, and interpretations.
Before using the indicator with real money, review its description, author documentation, and displayed outputs so you understand exactly what the particular version is designed to measure.
A well-structured analysis should help you answer several important questions:
- Where is the current market trading relative to the indicator's reference levels?
- Is price trending, consolidating, or approaching a potential turning point?
- Does the indicator support the direction suggested by price action?
- Where might a trade setup become invalid?
- Does the potential reward justify the risk?
These questions matter far more than simply buying when an indicator turns bullish or selling when it turns bearish.
Why Use the Market Gravity Indicator in Forex Trading?
The Forex market is constantly responding to changing liquidity, economic data, central bank policy, interest-rate expectations, and shifts in market sentiment.
Currency prices can trend strongly for hours or days, reverse unexpectedly, or remain trapped in a narrow trading range.
The challenge is identifying which market conditions are developing before committing capital.
The Market Gravity Indicator may provide a useful additional perspective on price behavior, depending on its specific design. Traders can evaluate its readings alongside established technical analysis tools to look for agreement between different forms of market evidence.
1. Analyze Potential Price Attraction Areas
Some market-analysis methods focus on areas where price may gravitate because of market structure, liquidity, prior trading activity, or other calculated reference levels.
If your version of the Market Gravity Indicator identifies such areas, observe how price behaves as it approaches them.
Does price accelerate toward the level? Does momentum weaken? Does the market reject the area or move through it decisively?
These observations can help you build a more complete picture of current market conditions.
Remember that an apparent price attraction area is not a guarantee that the market will reach it.
2. Evaluate Potential Trend Continuation
A developing trend can create opportunities when price retraces before continuing in its original direction.
For example, during an established EUR/USD uptrend, a pullback toward a relevant technical area may create a potential buying opportunity if price subsequently resumes its upward movement.
If the Market Gravity Indicator supports the same directional interpretation, you can investigate whether the setup meets your trading rules.
Always confirm the meaning of its readings using the documentation for the specific script you have selected.
3. Identify Conditions That Deserve Further Investigation
Not every indicator reading represents a trading opportunity.
A sudden change in an indicator's display may warrant closer examination, but it does not automatically confirm a reversal, breakout, or trend continuation.
Use the indicator to help identify situations worth investigating. Then examine price structure, momentum, volatility, and the broader market environment before deciding whether a trade is justified.
4. Develop a More Consistent Trading Process
A repeatable process can help prevent emotional decisions.
Instead of entering a position because price appears to be moving quickly, establish clear rules for market direction, entry confirmation, stop-loss placement, profit targets, and position sizing.
The Market Gravity Indicator can be one component of that process, provided you understand its limitations and test your approach before using it in a live account.
How To Find the Market Gravity Indicator on TradingView
TradingView provides charting tools and community-developed indicators that traders can use to study currency markets.
Follow these steps to locate the Market Gravity Indicator.
Visit TradingView and open a chart for the currency pair you want to analyze.
Step 2: Select a Forex Currency Pair
Start with a familiar market such as EURUSD, GBPUSD, or USDJPY.
For your initial analysis, use a liquid currency pair with which you are comfortable interpreting price movements.
Step 3: Open the Indicators Menu
Locate the Indicators button on the TradingView chart interface.
Open the indicator search panel and enter:
Market Gravity
Step 4: Review the Available Scripts
Examine the matching results carefully.
Check the indicator's full name, author, description, available documentation, and any usage instructions. Do not assume that every script with a similar name produces the same signals.
Step 5: Add Your Selected Indicator to the Chart
Select the version you intend to evaluate.
Allow the indicator to load, then examine its visual elements and settings. If the script includes configurable inputs, read their descriptions before making changes.
Step 6: Understand What You Are Seeing
Determine what each line, label, color, level, or other visual element represents.
If the script's documentation does not explain a particular display, do not guess at its meaning. Consult the author's instructions before incorporating it into your strategy.
You are now ready to begin evaluating the indicator in the context of actual Forex price action.
How To Use the Market Gravity Indicator Step by Step
Finding an indicator is easy. Using it effectively requires a clear analytical process.
The following framework helps you evaluate potential setups without assuming that the indicator predicts future prices.Step 1: Establish the Overall Market Direction
Begin by determining whether the currency pair is trending upward, trending downward, or moving sideways.
Look at the chart's swing highs and swing lows.
An uptrend generally produces higher highs and higher lows. A downtrend generally produces lower highs and lower lows. A sideways market tends to move within a relatively defined range.
You can also use a moving average or another trend-analysis tool to support your assessment.
For a deeper understanding of trend analysis, visit our Forex Trading education resources and explore how traders identify market direction before entering a position.
Internal link: Forex Trading
Step 2: Add the Market Gravity Indicator to Your Analysis
Once you understand the market's structure, examine the indicator's current readings.
Identify what its signals or reference levels are intended to communicate.
Ask yourself:
- Does the indicator support the direction of the prevailing trend?
- Is price approaching a level identified by the indicator?
- Is the market moving decisively or losing momentum?
- Does the indicator offer useful information beyond what the price chart already shows?
Do not force a bullish or bearish interpretation onto an indicator when its actual calculation or visual output does not support that conclusion.
Step 3: Confirm the Setup With Price Action
Price action provides essential context.
Look for evidence that the market is behaving in a way that supports your trade thesis.
Depending on the setup, that evidence might include a break of market structure, a successful retest of a broken level, a rejection from support or resistance, or a strong candle closing in the anticipated direction.
For example, suppose EUR/USD is trending upward and begins pulling back.
If your selected Market Gravity Indicator identifies an area worth monitoring, observe how price reacts there. A bullish rejection followed by a break above a nearby short-term swing high could provide additional evidence of renewed buying pressure.
The indicator alone does not confirm the trade. The combination of market context and observable price behavior is what deserves your attention.
Internal link: High Probable Japanese Candlestick Patterns
Step 4: Identify a Potential Entry
An entry should be based on a predefined trading rule rather than an emotional reaction to the chart.
For a possible bullish setup, your rules might require:
- An established upward market structure.
- A pullback toward a relevant technical area.
- A bullish price-action confirmation.
- An indicator reading consistent with your documented interpretation.
- A reasonable stop-loss location and potential reward relative to risk.
A bearish setup would use the corresponding conditions in the opposite direction.
These are examples of a trading framework, not verified signals generated by every Market Gravity Indicator script.
If the conditions do not align, waiting is a legitimate trading decision.
Step 5: Determine Where the Trade Is Invalidated
Before entering a position, determine the price level at which your trading thesis would no longer be valid.
A stop-loss may be placed beyond a relevant swing point or another technically justified level, depending on your strategy and current volatility.
Do not place a stop-loss at an arbitrary distance simply because it produces a larger position size.
Your stop-loss should reflect the setup's risk, while your position size should reflect the amount of capital you are prepared to risk.
Step 6: Establish a Realistic Profit Target
Potential targets may be based on previous swing highs or lows, support and resistance, range boundaries, or other levels identified by your trading plan.
If the Market Gravity Indicator displays reference areas that its documentation identifies as potential price targets, you can investigate whether those areas are relevant to the current market structure.
Never assume that price must reach a displayed level.
Compare the potential reward with the amount you could lose if the stop-loss is triggered. If the trade does not offer an acceptable reward relative to risk, consider passing on the setup.
Step 7: Manage the Trade According to Your Rules
After entering, avoid changing your plan simply because a candle moves against you or a new indicator reading appears.
Follow your predefined rules for managing risk, adjusting stops, taking partial profits, or exiting the trade.
A sound trading strategy must account for losing trades as well as winning trades.
The goal is not to predict every market movement. It is to execute a repeatable process in which risk is controlled and decisions are based on evidence.
Combining the Market Gravity Indicator With Other TradingView Tools
The Market Gravity Indicator does not need to operate in isolation.
Other technical analysis tools can provide additional context, provided each tool has a clear purpose and does not merely duplicate information already available on the chart.
Market Gravity Indicator + Support and Resistance
Support and resistance help traders identify areas where price has previously encountered buying or selling pressure.
If your Market Gravity Indicator highlights a relevant area, examine whether it coincides with an established support or resistance level.
The overlap may justify closer observation, but it does not guarantee that the level will hold.
Learn more about identifying these important areas in our Forex education resources.
Market Gravity Indicator + Japanese Candlestick Patterns
Candlestick patterns can help traders interpret the behavior of buyers and sellers at important price levels.
For example, a bullish rejection candle near support may deserve attention if the broader market structure also favors an upward move.
A bearish rejection near resistance may provide a reason to investigate a possible downside setup.
The context matters. A candlestick pattern appearing in the middle of an unclear trading range may offer little useful information.
Study the patterns, their limitations, and the market conditions in which they occur.
Internal link: High Probable Japanese Candlestick Patterns
Market Gravity Indicator + MACD
The Moving Average Convergence Divergence (MACD) indicator is commonly used to analyze momentum and potential changes in trend strength.
If the Market Gravity Indicator identifies an area of interest, MACD may provide an additional perspective on momentum.
For example, a potential bullish setup may warrant further investigation when price action improves and MACD momentum also strengthens.
However, momentum indicators can lag price and produce misleading readings in choppy markets. Confirmation from another indicator does not eliminate the risk of a losing trade.
Market Gravity Indicator + Moving Averages
Moving averages can help traders evaluate the broader direction of a market and distinguish between trending and less directional conditions.
A trader might monitor potential bullish setups when price is trading above a rising moving average, or potential bearish setups when price is below a declining moving average.
The appropriate moving average and its settings depend on the trading timeframe and strategy.
Avoid adding so many indicators that the chart becomes difficult to interpret. Each tool should contribute meaningful information to your decision-making process.
Which Forex Timeframe Should You Use?
The best timeframe depends on your trading style, available time, risk tolerance, and the specific behavior of the indicator you are using.
Trading style Possible chart approach Primary consideration
Scalping 1-minute to 5-minute charts Fast price changes, spread, and execution costs
Day trading 5-minute to 30-minute charts Intraday structure and volatility
Swing trading 1-hour to daily charts Larger market moves and overnight exposure
Position trading Daily to weekly charts Broader trends and fundamental conditions
These are general examples, not recommendations that the Market Gravity Indicator performs better on any particular timeframe.
Test your selected script on the timeframe you intend to trade.
You may also compare a higher timeframe with your entry timeframe. For example, a swing trader could evaluate the daily chart for broad direction and then use the four-hour chart to examine a potential setup.
Multi-timeframe analysis can provide context, but it cannot remove uncertainty from the market.
A Practical Forex Trading Example
Consider a hypothetical EUR/USD trading scenario.
EUR/USD has been forming higher highs and higher lows on the four-hour chart. Price then retraces toward a previously established support area.
You have added a Market Gravity Indicator script to TradingView and, after reviewing its documentation, identified a reading that you consider relevant to the current setup.
Rather than buying immediately, you follow a structured process.
First: You confirm that the broader market structure remains bullish.
Second: You examine how price behaves near support.
Third: You wait for a bullish price-action confirmation that satisfies your trading rules.
Fourth: You identify a technically justified stop-loss level and calculate your position size.
Fifth: You determine whether the potential profit target offers an acceptable reward relative to the risk.
Finally: You enter only if all your predefined conditions are satisfied.
If price breaks support and invalidates the setup, you accept that the trade is no longer justified.
If no valid confirmation appears, you do not trade.
This example illustrates a decision-making framework. It does not represent a historical test, a verified Market Gravity Indicator signal, or a guarantee of profitability.
Common Mistakes to Avoid When Using the Market Gravity Indicator
Even a useful analytical tool can become counterproductive when it is misunderstood or used without a plan.Mistake 1: Treating Every Signal as a Trading Instruction
No indicator can guarantee that the next market move will match its reading.
Use the indicator as one source of information and require your strategy's other conditions to be met.
Mistake 2: Ignoring the Overall Trend
A potentially attractive indicator reading can be misleading when it conflicts with the broader market structure.
Determine the market's condition before evaluating individual entry opportunities.
Mistake 3: Using Too Many Indicators
Adding more indicators does not necessarily improve trading decisions.
Several indicators may measure similar underlying information and create the illusion of confirmation without adding much independent evidence.
Choose a small number of complementary tools and understand what each contributes.
Mistake 4: Ignoring Stop-Loss Placement and Position Sizing
A technically promising setup can still produce a substantial loss when position sizing is excessive.
Define your risk before entering the trade.
Many traders use a planned risk of 1% or less of account equity per trade as a starting guideline, although the appropriate amount depends on individual circumstances and a strategy's tested risk characteristics. Even small risks can accumulate across consecutive losses.
Mistake 5: Assuming the Indicator Works Equally Well in Every Market
A strategy that performs acceptably in a strong trend may struggle in a narrow range.
Market conditions change. Evaluate how the indicator behaves during trending, ranging, and volatile periods.
Mistake 6: Failing to Test the Indicator
Before committing real capital, study the indicator's historical behavior and test your complete trading rules.
Check whether the script repaints historical signals, changes previous readings, or behaves differently after a candle closes. Some indicators use information that is not available until later, which can make historical signals look better than they would have appeared in real time.
If you are unfamiliar with the script's calculations, seek clarification from its author.
How To Test the Market Gravity Indicator Before Trading Live
A disciplined testing process can help you determine whether the indicator adds useful information to your strategy.
1. Define your trading rules. Specify the market conditions, entry trigger, stop-loss, target, and exit rules before evaluating results.
2. Choose your currency pairs and timeframes. Avoid drawing conclusions from a handful of cherry-picked examples.
3. Review historical setups. Examine both winning and losing trades, including periods when the market was trending and when it was moving sideways.
4. Account for trading costs. Include spreads, commissions, and realistic slippage where applicable.
5. Check for repainting and look-ahead bias. Determine whether signals change after they appear or depend on information unavailable at the time of entry.
6. Record your results. Track win rate, average win, average loss, maximum drawdown, and expectancy after costs.
7. Forward-test before risking real money. Use a demo account or another suitable simulation method to observe how your rules behave as new price data arrives.
A high win rate alone does not establish profitability. A strategy can win frequently and still lose money if its losing trades are substantially larger than its winning trades.
The objective is to establish whether the complete trading method has a defensible statistical advantage, not simply whether the indicator looks impressive on a chart.
Is the Market Gravity Indicator Enough to Trade Forex Profitably?
No single indicator is enough to establish a reliable, profitable Forex trading strategy.
The Market Gravity Indicator may help you organize your analysis or identify areas that deserve attention. Its usefulness depends on the exact script, the information it provides, and whether that information improves your decisions when tested objectively.
Successful trading requires much more than indicator selection.
You must understand market structure, recognize the limitations of technical signals, control position size, manage losses, and follow a consistent trading plan.
You must also account for economic announcements, changing volatility, spreads, and the possibility that price will move against your position without warning.
The objective is not to find a magic indicator. It is to build a repeatable trading process that protects capital while allowing well-tested opportunities to develop.
Build Your Forex Trading Skills With Forex Trading Unlocked
Learning how to use the Market Gravity Indicator is one step toward becoming a more informed Forex trader.
The next step is building a broader understanding of the techniques that help traders evaluate market direction, recognize potential setups, and control risk.
Forex Trading Unlocked provides educational resources designed to help you develop that foundation.
Start With the Free Forex Trading Starter Kit
Newer traders can begin with our Free Forex Trading Starter Kit, designed to introduce important concepts and help you develop a more structured approach to the Forex market.
Learn the fundamentals before risking your trading capital.
Get started here: Forex Trading Unlocked
Master High-Probability Japanese Candlestick Patterns
Price action is an important part of evaluating whether an indicator reading deserves attention.
Our Japanese candlestick education resources can help you understand how traders interpret bullish and bearish price behavior, identify potential reversals, and evaluate continuation setups.
Explore the guide: High Probable Japanese Candlestick Patterns
Explore Forex Trading Strategies and Education
Continue developing your technical analysis skills by studying trend identification, support and resistance, risk management, and other Forex trading concepts.
The more clearly you understand the market, the easier it becomes to evaluate whether a new indicator genuinely contributes to your trading process.
Visit: Forex Trading Education
Learn More About TradingView
TradingView offers charting tools that traders can use to study currency pairs, evaluate technical indicators, and develop their own analytical workflows.
If you are building a TradingView-based Forex strategy, explore the available charting features and indicator documentation to understand how different tools can support your analysis.
Explore TradingView: TradingView Official Website
Frequently Asked Questions About the Market Gravity Indicator
What does the Market Gravity Indicator do?
The Market Gravity Indicator is the name used for TradingView scripts that may analyze potential price relationships, market direction, or reference areas. Its exact function depends on the specific script and its calculation method. Review the author's documentation to understand what its signals actually represent.
Is the Market Gravity Indicator available on TradingView?
Search for Market Gravity in TradingView's Indicators panel. Availability, access restrictions, and functionality depend on the specific script. Some indicators may be public, while others may require permission or payment.
Can beginners use the Market Gravity Indicator?
Beginners can study the indicator, but they should first learn basic chart reading, market structure, support and resistance, and risk management. Start with a demo account and avoid relying on unfamiliar signals to make live trading decisions.
Does the Market Gravity Indicator predict Forex prices?
An indicator may generate readings or identify conditions associated with potential price movements, but it cannot reliably predict every future market move. Treat its output as analytical information rather than certainty.
Which currency pairs work best with the Market Gravity Indicator?
There is no universal answer without testing the specific script. Evaluate its behavior on the currency pairs you intend to trade, accounting for liquidity, volatility, trading costs, and the strategy's rules.
Which timeframe is best for the Market Gravity Indicator?
The appropriate timeframe depends on the script, your trading style, and your tested strategy. Compare results across relevant timeframes rather than assuming a lower or higher timeframe will automatically perform better.
Can I combine the Market Gravity Indicator with other indicators?
Yes. You can evaluate it alongside tools such as MACD, moving averages, support and resistance, and Japanese candlestick analysis. Choose complementary tools and test whether each one improves your decision-making.
Should I use the Market Gravity Indicator for live Forex trading?
Only consider doing so after understanding the script, testing your trading rules, evaluating trading costs, and practicing with simulated trades. No indicator eliminates trading risk or guarantees profits.
Final Thoughts: Use the Market Gravity Indicator With a Trading Plan
The Market Gravity Indicator on TradingView may provide another perspective on Forex price behavior, but its real value depends on how you interpret and apply its readings.
Learn what the specific script measures. Establish the overall market direction. Confirm potential opportunities with price action. Define your stop-loss and profit target. Test your rules across different market conditions before risking real money.
Most importantly, remember that consistent Forex trading is built on preparation, risk management, and disciplined execution—not on any single indicator.
Continue your education with Forex Trading Unlocked, explore our Japanese candlestick resources, and build the analytical skills needed to evaluate trading opportunities with greater confidence.
Start learning today: Visit Forex Trading Unlocked
Risk Disclaimer: Forex trading involves substantial risk and may not be suitable for every investor. Leverage can magnify both gains and losses. Educational material and technical indicators are not financial advice, and no indicator or trading strategy guarantees profits. Always evaluate your financial circumstances and risk tolerance before trading.
👉 “Get Instant Access (Check Your Email)”
💥 IMPORTANT: One Last Step Required
After you enter your email, check your inbox (or spam folder) for a confirmation email.
👉 Click the confirmation link so I can send you your free Forex training.
⚠️ If you don’t confirm, I can’t send you anything.
👉 “⚠️ Access expires if not confirmed within 24 hours minutes.”
👉 “Takes 10 seconds. Instant access after email confirmation.”