How To Use The Market Path Forecast Indicator On TradingView In Forex Trading
Can you see where the Forex market may be heading before you enter a trade?
Every Forex trader faces the same challenge: the market is constantly moving, but the opportunity is knowing how to interpret that movement before making a trading decision.
The Market Path Forecast Indicator on TradingView is designed to help traders analyze potential market direction and visualize where price may be heading based on the information available on the chart.
Instead of relying on a single signal, traders can use the Market Path Forecast Indicator as another layer of technical analysis when evaluating Forex trends, potential reversals, market momentum, support and resistance, and possible trade setups.
And that is where this indicator becomes particularly interesting.What Is The Market Path Forecast Indicator?
The Market Path Forecast Indicator is a TradingView charting tool that helps traders analyze the potential path of the market.
Rather than simply looking at where price has already been, the indicator can be used to help traders think about where price could potentially travel next.
That distinction matters.
Forex trading is not about knowing the future with certainty. No indicator can guarantee what the market will do next.
The objective is to build a structured process for analyzing the probabilities in front of you.
The Market Path Forecast Indicator can become part of that process.
When combined with price action, trend analysis, support and resistance, candlestick patterns, and proper risk management, it can give Forex traders another perspective when analyzing potential opportunities.
Why Market Direction Matters In Forex Trading
One of the biggest mistakes traders make is entering a trade without first understanding the broader market environment.
A bullish-looking setup can fail in a strong bearish market.
A bearish-looking setup can fail when buyers are firmly in control.
And a seemingly perfect entry can become a losing trade when the trader ignores the larger market structure.
This is why market direction matters.
Before entering a Forex trade, you should be asking questions such as:
- Is the market trending?
- Is price moving higher or lower?
- Is momentum strengthening or weakening?
- Could the current move be approaching a reversal?
- Where are important support and resistance levels?
- Is the potential trade aligned with the larger trend?
- Where would the trade idea be proven wrong?
- Is the potential reward worth the risk?
The Market Path Forecast Indicator can be incorporated into this analysis to help you evaluate potential market direction before committing capital.
How To Add The Market Path Forecast Indicator To TradingView
TradingView makes it easy to add technical indicators to your Forex charts.
To begin:
- Open TradingView.
- Open the Forex pair you want to analyze.
- Select the Indicators option.
- Search for Market Path Forecast.
- Select the appropriate indicator from the results.
- Add it to your chart.
- Review the indicator's plotted information alongside price action.
Once the indicator is displayed, resist the temptation to immediately enter a trade.
The first objective should be analysis.
Look at what the indicator is showing and compare it with what price itself is doing.
That comparison is critical.
How To Read The Market Path Forecast Indicator
The Market Path Forecast Indicator should not be treated as a magic buy-and-sell button.
Instead, think of it as another analytical tool.
Start by examining the relationship between the indicator's forecast information and actual price movement.1. Identify The Current Market Direction
Start with the most basic question:
What is price actually doing?
Look for:
- Higher highs
- Higher lows
- Lower highs
- Lower lows
- Consolidation
- Breakouts
- Pullbacks
- Potential reversals
Then compare the market structure with the forecast information displayed by the indicator.
When multiple pieces of technical evidence point in the same general direction, the setup may deserve closer examination.
2. Look For Alignment
One of the most useful ways to approach any indicator is to look for confluence.
For example, you may identify a potential bullish market path while price is also:
- Holding above support
- Creating higher lows
- Breaking resistance
- Showing bullish candlestick behavior
- Maintaining an established uptrend
That does not guarantee that price will rise.
But it gives you multiple pieces of information to evaluate instead of depending on one indicator alone.
The same concept applies to bearish conditions.
If the forecast information aligns with bearish market structure, resistance, lower highs, and bearish price action, you have a more complete technical picture to analyze.
Market Path Forecast + Support And Resistance
One of the strongest ways to add context to an indicator is by combining it with support and resistance analysis.
Support represents an area where buying interest may appear.
Resistance represents an area where selling pressure may develop.
The key question becomes:
Does the potential market path make sense relative to important price levels?
For example, if the market path suggests potential upside but price is approaching major resistance, you should recognize that resistance may become an important decision point.
Likewise, if potential downside is being identified while price is sitting directly above significant support, that support level deserves attention.
This is why technical indicators should be used within a larger trading framework.
Learn more about identifying important price levels with our [Support and Resistance Forex Trading resources].
Market Path Forecast + Candlestick Patterns
Price action can provide another important layer of confirmation.
Candlestick patterns can help traders understand the behavior of buyers and sellers at important areas of the chart.
A potential market direction combined with a high-probability candlestick setup can create a much more structured trading opportunity than either piece of information by itself.
Look for candlestick formations around:
- Support
- Resistance
- Breakouts
- Pullbacks
- Trend reversals
- Previous highs and lows
- Major market levels
This is particularly important because the indicator is providing analytical information while the candlesticks show what buyers and sellers are actually doing.
Don't just ask what the indicator says. Ask whether price action agrees.
👉 Explore our High Probability Japanese Candlestick Patterns resources to strengthen your price-action analysis.
Using Multiple Timeframes With The Market Path Forecast Indicator
Another powerful way to analyze a Forex setup is through multiple timeframe analysis.
A setup that looks attractive on a five-minute chart may look completely different on the one-hour or four-hour chart.
That is why traders should consider the larger market environment before entering short-term trades.
For example:Higher Timeframe
Use a larger timeframe to identify:Trading Timeframe
- Overall trend
- Major support
- Major resistance
- Market structure
- Larger potential directional bias
Move to your primary trading timeframe and look for:
- Market-path information
- Pullbacks
- Breakouts
- Trend continuation
- Potential reversal conditions
Entry Timeframe
Finally, use your entry timeframe to look for:
- Price-action confirmation
- Candlestick confirmation
- Breakout confirmation
- Risk-defined entry opportunities
This creates a top-down approach rather than making decisions from one isolated chart.
Can The Market Path Forecast Indicator Predict The Forex Market?
No indicator can predict the Forex market with certainty.
The Market Path Forecast Indicator should therefore be viewed as a technical analysis tool, not a guarantee of future price movement.
Markets can react unexpectedly to:
- Economic data
- Central-bank decisions
- Interest-rate expectations
- Inflation reports
- Employment data
- Geopolitical developments
- Unexpected volatility
- Liquidity conditions
A forecast can be wrong.
A technical setup can fail.
That is why every trading strategy needs a defined risk-management process.
The goal is not to eliminate losing trades.
The goal is to ensure that a losing trade does not destroy your trading account.
Market Path Forecast Indicator Trading Strategy
A simple framework for using the indicator can be built around five steps.
Step 1: Identify The Trend
Determine whether the market is generally:
Bullish → Bearish → Sideways
Do not force a trend when the market is clearly consolidating.
Step 2: Analyze The Market Path
Review the information provided by the Market Path Forecast Indicator.
Ask:
Does the potential path agree with the broader market structure?
Step 3: Find Key Price Levels
Mark important:
- Support
- Resistance
- Swing highs
- Swing lows
- Breakout levels
Step 4: Wait For Confirmation
Do not enter simply because an indicator appears bullish or bearish.
Look for supporting price action.
Step 5: Define Your Risk
Before entering the trade, determine:
- Entry
- Stop-loss
- Profit target
- Position size
- Maximum account risk
Only then should the trade be considered.
Market Path Forecast Indicator For Forex Scalping
Scalpers operate in a very fast environment.
Because short-term price movement can contain considerable noise, traders using the Market Path Forecast Indicator for scalping should avoid treating every change as a trade signal.
Instead, consider using the indicator alongside:
- Short-term market structure
- Intraday support and resistance
- Price action
- Momentum
- Volatility
- Strict risk management
The faster the timeframe, the more important disciplined execution becomes.
Market Path Forecast Indicator For Day Trading
Day traders can use the Market Path Forecast Indicator as part of a broader intraday analysis process.
Before the trading session, identify the major levels that could influence price.
Then monitor how price behaves as it approaches those areas.
The most interesting opportunities may occur when several factors begin pointing toward the same potential scenario.
For example:
Market Structure + Key Level + Forecast Information + Price Action = Stronger Analytical Context
This does not eliminate risk.
It simply creates a more organized way to evaluate the market.
Market Path Forecast Indicator For Swing Trading
Swing traders can also incorporate market-path analysis into their larger timeframe approach.
Instead of focusing on every short-term fluctuation, swing traders can concentrate on broader market structure and potential directional moves.
Higher timeframes can help filter out some of the noise found on very short-term charts.
Consider examining:
- Daily trends
- Four-hour trends
- Major support and resistance
- Swing highs and lows
- Trend continuation
- Potential reversals
Then use the Market Path Forecast Indicator as another component of the overall analysis.
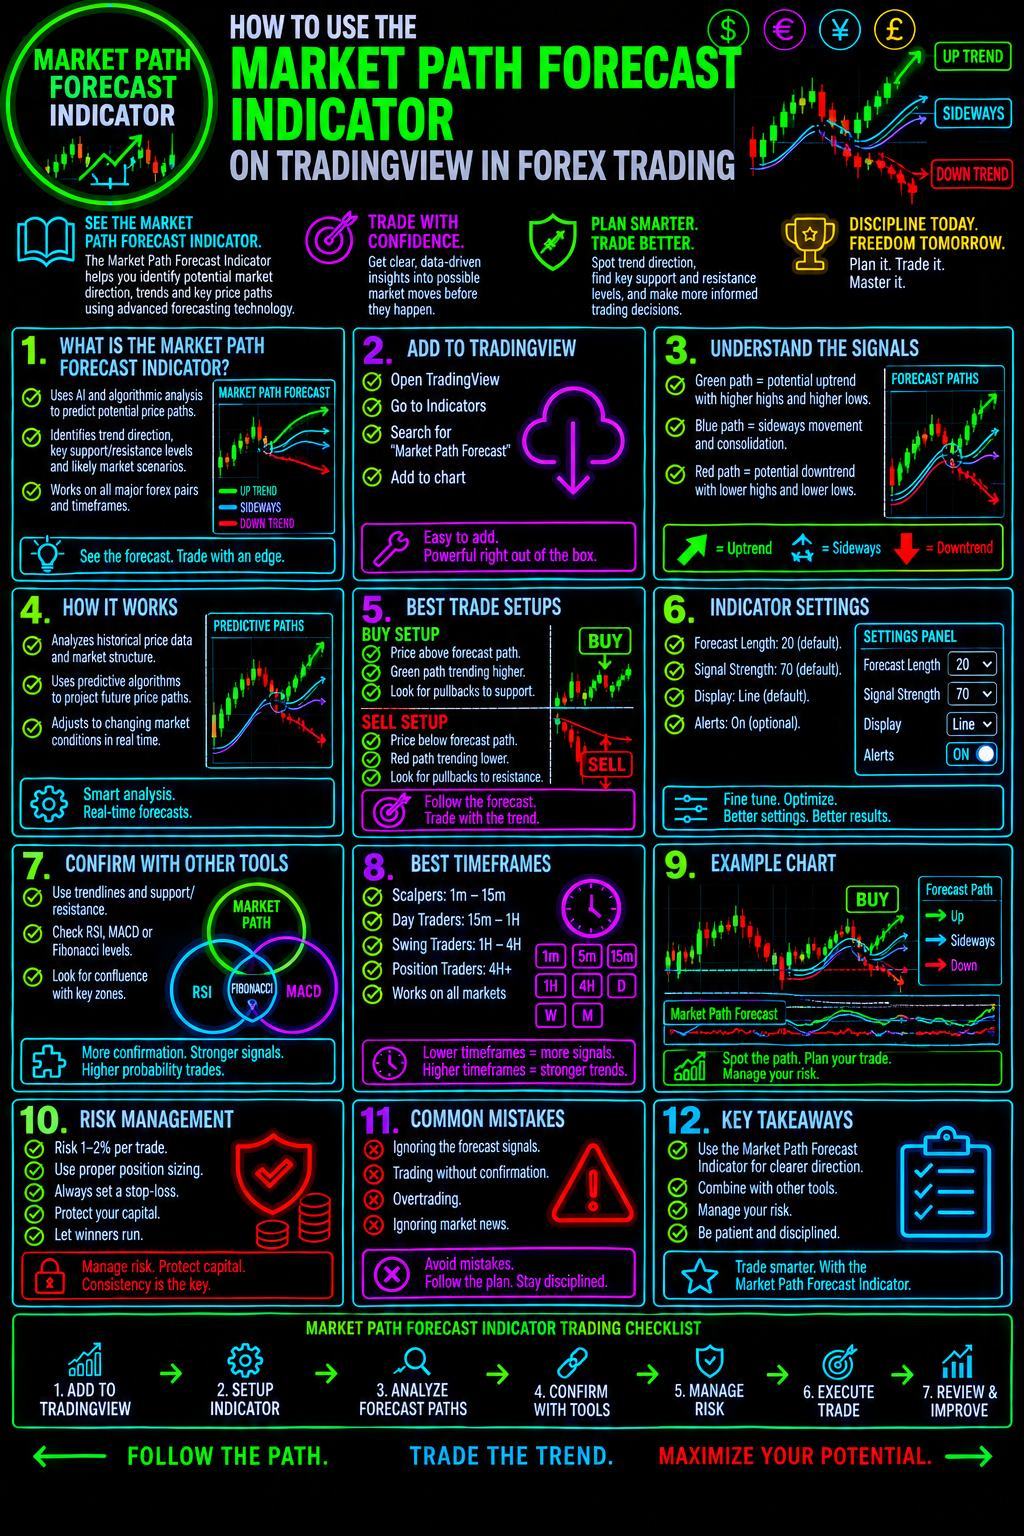
Common Mistakes When Using The Market Path Forecast Indicator
Even a useful technical tool can be misused.
Mistake #1: Treating The Indicator As A Guaranteed Forecast
A forecast is not a certainty.
Always compare the indicator with actual price behavior.
Mistake #2: Entering Immediately
Seeing a potential directional signal does not automatically mean you should enter.
Wait for your trading conditions to develop.
Mistake #3: Ignoring Support And Resistance
A potential bullish move directly into major resistance requires a different analysis than a bullish move emerging from support.
Mistake #4: Ignoring The Higher Timeframe
Short-term signals can conflict with the larger trend.
Always understand the bigger picture.
Mistake #5: Risking Too Much
No indicator can compensate for poor risk management.
Protecting trading capital must remain part of the strategy.
Mistake #6: Using Too Many Indicators
Adding indicator after indicator does not necessarily improve your trading.
The objective should be clarity, not chart clutter.
Build A Complete Forex Trading System
The Market Path Forecast Indicator can be useful, but it should not be your entire trading system.
Professional-level technical analysis requires multiple components working together.
Your trading framework should address:
Market Direction
Where is the market potentially heading?
Market Structure
What is price actually doing?
Entry
What specific conditions trigger the trade?
Stop-Loss
Where is the trading idea invalidated?
Take-Profit
Where will profits be taken?
Risk Management
How much capital is being placed at risk?
Trade Management
What happens after the trade is entered?
That is the difference between randomly taking signals and following a repeatable trading process.
Take Your Forex Trading Analysis Further
If you want to become a more disciplined Forex trader, don't stop with one indicator.
Build your knowledge across the entire trading process.
Explore more Forex Trading Strategies, learn how to recognize High Probability Japanese Candlestick Patterns, study Support and Resistance, and strengthen your understanding of Forex Risk Management.
The more pieces of the trading puzzle you understand, the easier it becomes to create a process that fits your trading style.
Want To Improve Your Forex Trading?
The Market Path Forecast Indicator can help you analyze potential market direction—but the indicator is only one piece of the puzzle.
The real advantage comes from knowing how to combine technical analysis, price action, market structure, entries, exits, and risk management into one repeatable trading process.
That's exactly what Forex Trading Unlocked is built to help you do.Start Here:
FREE FOREX TRADING STARTER KIT
Learn the foundational concepts every Forex trader should understand before putting serious capital at risk.
[GET THE FREE FOREX TRADING STARTER KIT →]
Then continue building your trading knowledge with:
- Forex Trading Strategies
- High Probability Japanese Candlestick Patterns
- Forex Risk Management
- Support & Resistance
- Technical Analysis
- TradingView Indicators
- Forex Trading Courses
- Forex Trading Education
Final Thoughts
The Market Path Forecast Indicator on TradingView can give Forex traders another perspective when analyzing potential market direction.
But successful trading is not about finding one magical indicator.
It is about developing a repeatable process.
Use the Market Path Forecast Indicator to help analyze potential direction. Then bring in market structure, support and resistance, candlestick behavior, multiple timeframe analysis, and disciplined risk management.
Analyze the market. Wait for your setup. Define your risk. Execute your plan.
That is how an indicator becomes part of a trading system rather than simply another signal on a chart.Ready To Unlock More Forex Trading Knowledge?
Continue exploring Forex Trading Unlocked and build your knowledge one strategy, indicator, and trading concept at a time.
[EXPLORE FOREX TRADING UNLOCKED →]
[GET THE FREE FOREX TRADING STARTER KIT →]
[EXPLORE OUR FOREX TRADING COURSES →]
[LEARN HIGH-PROBABILITY CANDLESTICK PATTERNS →]
👉 “Get Instant Access (Check Your Email)”
💥 IMPORTANT: One Last Step Required
After you enter your email, check your inbox (or spam folder) for a confirmation email.
👉 Click the confirmation link so I can send you your free Forex training.
⚠️ If you don’t confirm, I can’t send you anything.
👉 “⚠️ Access expires if not confirmed within 24 hours minutes.”
👉 “Takes 10 seconds. Instant access after email confirmation.”