How To Use The Mirage Liquidity Sweep Pro Indicator On TradingView In Forex Trading
Liquidity doesn't disappear. It gets hunted.
The Mirage Liquidity Sweep Pro Indicator on TradingView can help Forex traders identify potential liquidity sweeps, understand where price may be targeting resting orders, and recognize areas where a sharp market reaction could develop.
But simply adding an indicator to a TradingView chart isn't enough.
The real advantage comes from understanding what the indicator is showing, why liquidity matters, and how to combine its signals with price action, market structure, trend direction, support and resistance, and disciplined risk management.
In this guide, you'll learn how to use the Mirage Liquidity Sweep Pro Indicator as part of a structured Forex trading approach.
You'll discover:
- What a liquidity sweep is
- How liquidity affects Forex price movement
- How to add the Mirage Liquidity Sweep Pro Indicator to TradingView
- How to interpret liquidity sweep signals
- How traders can use bullish and bearish sweeps
- How to combine liquidity sweeps with market structure
- How multiple timeframes can improve confirmation
- Where stop-loss and take-profit decisions fit into the setup
- Common mistakes traders make when using liquidity indicators
- How to build a repeatable liquidity-sweep trading process
The objective isn't to chase every signal. It's to learn how to recognize when a liquidity event may be creating a higher-quality trading opportunity.
What Is The Mirage Liquidity Sweep Pro Indicator?
The Mirage Liquidity Sweep Pro Indicator is designed to help traders analyze liquidity sweeps and potential areas where price has moved through important highs, lows, or liquidity zones before potentially reversing or continuing.
Liquidity is one of the most important concepts in modern price-action trading.
Markets frequently move toward areas where orders are concentrated. These areas can develop around:
- Previous swing highs
- Previous swing lows
- Equal highs
- Equal lows
- Support zones
- Resistance zones
- Consolidation ranges
- Psychological price levels
- Previous session highs and lows
When price pushes through one of these areas, traders may initially interpret the move as a breakout.
Sometimes it is.
Other times, price quickly reverses.
That distinction is where liquidity-sweep analysis becomes particularly interesting.
What Is A Liquidity Sweep In Forex Trading?
A liquidity sweep occurs when price moves into an area where liquidity is believed to be concentrated, often taking out a previous high or low before reversing or continuing.
Consider a simple example.
EUR/USD establishes a visible swing high.
Many traders may place:
- Buy-stop orders above the high
- Stop-loss orders from short positions above the high
That creates a potential pool of liquidity.
Price then rallies above the previous high.
Breakout traders may enter long.
But instead of continuing higher, price falls sharply back below the previous high.
That movement may represent a liquidity sweep.
The same concept can occur below previous lows.
This is why traders should avoid automatically assuming that every breakout represents a genuine trend continuation.
The reaction after the sweep can be just as important as the sweep itself.
Why Liquidity Sweeps Matter To Forex Traders
Forex markets can move quickly around obvious technical levels.
A trader who understands liquidity can begin looking beyond the simple question:
"Did price break resistance?"
Instead, the trader can ask:
"What happened after price took the liquidity above resistance?"
That change in perspective can improve market analysis.
A sweep followed by strong rejection may provide a completely different trading context from a breakout followed by sustained acceptance above the level.
The Mirage Liquidity Sweep Pro Indicator can therefore be incorporated into a broader decision-making process rather than treated as a standalone buy-or-sell machine.
How To Add The Mirage Liquidity Sweep Pro Indicator To TradingView
Getting started is straightforward.
Step 1: Open TradingView
Open your TradingView chart and select the Forex pair you want to analyze.
Popular markets include:
Step 2: Open The Indicators Menu
Select Indicators from the TradingView chart interface.
Search for:
Mirage Liquidity Sweep Pro
Select the appropriate indicator from the available results.
Step 3: Add The Indicator To Your Chart
Once added, the indicator will display its liquidity-related information directly on the price chart.
Take time to understand what each visual element represents before using it for live trading decisions.
Step 4: Adjust Your Chart
Choose a timeframe appropriate for your trading style.
For example:
Scalping: 1-minute to 15-minute charts
Day trading: 15-minute to 1-hour charts
Swing trading: 4-hour to daily charts
The exact timeframe isn't the most important factor.
Consistency is.
How To Read Liquidity Sweep Signals
The most important mistake to avoid is treating every liquidity sweep as an automatic trade.
A liquidity sweep is information.
It isn't necessarily an entry.
Instead, examine three things:
1. Where Did The Sweep Occur?
Location matters.
A sweep occurring directly into a major resistance area may have more significance than a random sweep in the middle of a trading range.
2. What Did Price Do After The Sweep?
Watch the reaction.
Did price:
- Reject the level?
- Close back inside the range?
- Produce a strong reversal candle?
- Continue through the level?
- Establish new market structure?
The reaction can provide important confirmation.
3. Does The Broader Market Structure Agree?
A sweep should be analyzed within the larger market environment.
Ask:
Is the market trending?
Is price ranging?
Are higher highs and higher lows forming?
Are lower highs and lower lows forming?
Is price approaching a major support or resistance area?
This additional context can help separate potentially meaningful setups from market noise.
Bullish Liquidity Sweep Setup
A potential bullish liquidity sweep can develop when price moves below a previous low and then quickly reverses higher.
A basic sequence might look like this:
Previous Low → Liquidity Sweep → Rejection → Bullish Structure → Potential Long Setup
For example, GBPUSD establishes a recognizable swing low.
Price later drops below that low.
Stops beneath the previous low may be triggered.
Then price rapidly moves back above the level.
A trader could wait for additional confirmation before considering a long position.
Possible confirmation factors include:
- Bullish rejection
- Strong bullish candle
- Market-structure shift
- Break of a short-term swing high
- Support confirmation
- Favorable risk-to-reward ratio
The key principle is simple:
Don't buy merely because liquidity was swept.
Wait for evidence that the market is actually responding to the sweep.
Bearish Liquidity Sweep Setup
The opposite situation can occur above a previous high.
A simplified bearish setup could look like:
Previous High → Liquidity Sweep → Rejection → Bearish Structure → Potential Short Setup
Price pushes above a previous swing high.
Liquidity above the level may be triggered.
Price then falls back below the previous high.
If bearish confirmation follows, the sweep may become part of a potential short setup.
Again, the sweep itself isn't the complete trade.
Context + confirmation + risk management create the setup.
Use Multiple Timeframes For Better Context
One of the most powerful ways to improve liquidity-sweep analysis is to stop looking at a single timeframe in isolation.
A higher timeframe can establish the broader market environment.
A lower timeframe can then help identify a more precise setup.
For example:Higher Timeframe
Use the 4-hour chart to identify:Trading Timeframe
- Major trend
- Significant highs and lows
- Support
- Resistance
- Major liquidity areas
Move to the 1-hour chart to identify:Entry Timeframe
- Developing structure
- Liquidity sweeps
- Breakouts
- Rejections
Move to a lower timeframe when appropriate to look for:
- Confirmation
- Market-structure shifts
- Entry triggers
- Defined risk
This creates a top-down process rather than allowing one isolated indicator signal to dictate the trade.
Combine Liquidity Sweeps With Support And Resistance
Liquidity analysis becomes particularly powerful when combined with traditional technical analysis.
Imagine price approaches a major resistance zone.
Instead of immediately shorting the resistance, wait.
Price pushes above the resistance.
A liquidity sweep occurs.
Price then falls back below the resistance.
Now the trader has more information.
The market has:
- Reached resistance
- Taken liquidity above the level
- Failed to sustain the breakout
- Returned below resistance
That combination may provide a stronger bearish context than resistance alone.
The same logic can be applied to support.
Liquidity Sweeps And Market Structure
Market structure is another important confirmation tool.
For a potential bullish reversal, traders may look for:
Sweep of Low → Rejection → Higher Low → Break of Short-Term High
For a potential bearish reversal:
Sweep of High → Rejection → Lower High → Break of Short-Term Low
This approach helps prevent traders from entering solely because a liquidity sweep appeared.
Instead, the trader waits for the market to demonstrate a potential change in behavior.
Liquidity Sweeps Don't Always Mean Reversal
This is critical.
Not every liquidity sweep produces a reversal.
Sometimes price takes liquidity above a high and continues aggressively higher.
Sometimes price moves below a low and continues falling.
Markets are dynamic.
Therefore, the Mirage Liquidity Sweep Pro Indicator should be treated as an analytical tool, not a guarantee of future price direction.
The strongest approach is to combine indicator information with:
- Price action
- Market structure
- Trend
- Key levels
- Volatility
- Economic conditions
- Risk management
Common Mistakes When Using Liquidity Sweep Indicators
Mistake #1: Trading Every Sweep
A sweep is not automatically a trade signal.
Wait for context and confirmation.
Mistake #2: Ignoring Higher Timeframes
A five-minute sweep occurring directly against a powerful daily trend may not carry the same significance as a sweep aligned with the broader market environment.
Mistake #3: Entering Too Quickly
Some traders enter immediately when price takes a previous high or low.
Waiting for the reaction can provide additional information.
Mistake #4: Using Excessive Leverage
A high-probability setup can still lose.
Risk must remain controlled.
Mistake #5: Moving The Stop-Loss
Once a trade is invalidated, moving the stop simply to avoid taking the loss can turn a manageable losing trade into a much larger one.
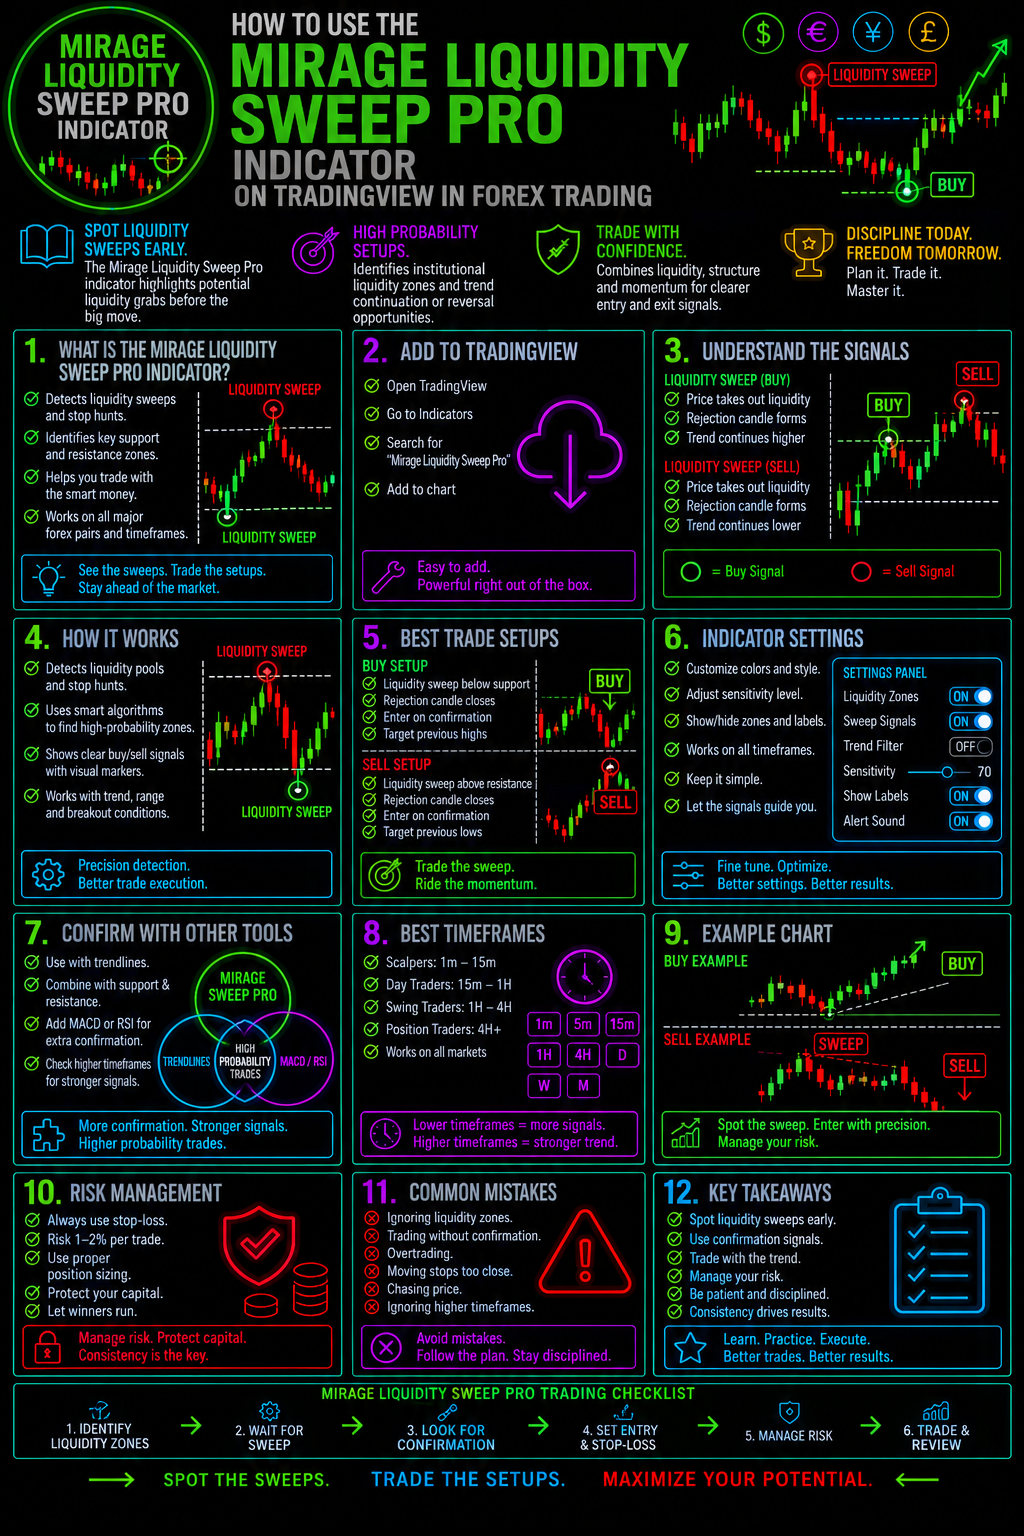
How To Build A Liquidity Sweep Trading Plan
Rather than trading randomly, create a checklist.Before The Trade
Ask:
1. What is the higher-timeframe trend?
2. Where are the major highs and lows?
3. Where could liquidity be concentrated?
4. Has price swept that area?
5. What happened after the sweep?
6. Is there market-structure confirmation?
7. Where is the trade invalidated?
8. Where is the logical profit target?
9. Is the risk-to-reward ratio acceptable?
10. Does the setup meet my trading rules?
If the answer to several of these questions is no, there may be no reason to force the trade.
The best trade can sometimes be the trade you don't take.
Mirage Liquidity Sweep Pro + TradingView = A Powerful Combination
TradingView provides the charting environment.
The Mirage Liquidity Sweep Pro Indicator can add another layer of liquidity-focused analysis.
But the real edge comes from how the information is interpreted.
The goal isn't to create a chart covered with indicators.
The goal is to develop a clear trading process.
One that helps you identify:
Where price is.
Where liquidity may be.
What price just did.
What the broader market structure is doing.
Where the trade becomes invalid.
Where the potential reward justifies the risk.
That is a much more disciplined approach to Forex trading.
Take Your Forex Trading Analysis Further
If liquidity sweeps have changed the way you look at the Forex market, don't stop with one indicator.
Forex Trading Unlocked gives you the opportunity to build a broader understanding of price action, technical analysis, Japanese candlesticks, market structure, trading strategies, risk management, and real-world Forex execution.Start Building Your Forex Trading Edge
Want to understand the market instead of simply reacting to it?
Explore more Forex Trading Unlocked education and discover strategies, indicators, and trading concepts designed to help you become a more informed and disciplined trader.
[EXPLORE FOREX TRADING UNLOCKED →]
Final Thoughts
The Mirage Liquidity Sweep Pro Indicator can provide traders with another way to study the relationship between price, liquidity, market structure, and potential reversals.
But successful Forex trading isn't about finding one magical indicator.
It's about building a repeatable process.
Use the indicator to help identify potential liquidity events.
Use price action to understand the reaction.
Use market structure to establish context.
Use multiple timeframes to see the bigger picture.
And use risk management to protect your trading capital.
The indicator can help you see the setup. Your trading plan determines whether you should act on it.
Stop Chasing Price. Start Understanding Why It Moves.
Liquidity is one of the most overlooked concepts in Forex trading.
Learn how to recognize where liquidity may be sitting, how price interacts with those areas, and how to incorporate liquidity analysis into a disciplined Forex trading strategy.
Explore more Forex Trading Unlocked strategies, indicator tutorials, and trading education today.
[START LEARNING →]
👉 “Get Instant Access (Check Your Email)”
💥 IMPORTANT: One Last Step Required
After you enter your email, check your inbox (or spam folder) for a confirmation email.
👉 Click the confirmation link so I can send you your free Forex training.
⚠️ If you don’t confirm, I can’t send you anything.
👉 “⚠️ Access expires if not confirmed within 24 hours minutes.”
👉 “Takes 10 seconds. Instant access after email confirmation.”