How To Use The Momentum Bias Index Indicator On TradingView In Forex Trading
Turn Market Momentum Into A Clearer Forex Trading Decision
Forex traders are constantly trying to answer three critical questions:
Is the market moving with strength? Is momentum shifting? And is the current trend worth trading?
The Momentum Bias Index Indicator on TradingView can help traders analyze these questions by providing a visual way to assess momentum and directional market bias.
Instead of relying on price movement alone, traders can use momentum-based information alongside price action, trend structure, support and resistance, and other technical indicators to build a more complete trading decision.
This guide explains how to use the Momentum Bias Index Indicator on TradingView for Forex trading, how to interpret its signals, how to combine it with other technical tools, and how to avoid some of the common mistakes traders make when using momentum indicators.
Important: No indicator predicts the future. The Momentum Bias Index should be used as part of a complete trading process that includes risk management and disciplined trade execution.
What Is The Momentum Bias Index Indicator?
The Momentum Bias Index is a technical analysis tool designed to help traders evaluate market momentum and directional bias.
Momentum is important because price does not simply move from one level to another. Markets accelerate, slow down, consolidate, reverse, and transition between bullish and bearish conditions.
A momentum-based indicator can help traders identify these changes before making a trading decision.
For Forex traders, this can be particularly useful because currency markets frequently experience:
- Strong directional trends
- Short-term momentum bursts
- Consolidation periods
- Breakouts
- Momentum reversals
- False breakouts
- Trend continuation moves
The goal is not to blindly follow an indicator signal.
The goal is to understand whether the indicator's momentum information agrees with what price is actually doing.
Why Momentum Matters In Forex Trading
Price direction and momentum are related, but they are not exactly the same thing.
A currency pair can continue moving higher while bullish momentum begins weakening. Likewise, a pair can move lower while bearish momentum starts losing strength.
This distinction matters.
Consider a EUR/USD rally.
If price continues making higher highs and higher lows while momentum remains strong, the bullish trend may have confirmation.
But if price reaches another higher high while momentum begins deteriorating, traders may want to pay closer attention.
That does not automatically mean EUR/USD will reverse.
It means the market may be entering a condition where confirmation becomes increasingly important.
This is where a momentum bias indicator can become useful.
How To Add The Momentum Bias Index To TradingView
TradingView makes it easy to add technical indicators directly to your chart.
To begin:
Open your TradingView chart and select the Forex currency pair you want to analyze.
Popular examples include:
Step 2: Select Indicators
At the top of the TradingView chart, select Indicators.
Step 3: Search For Momentum Bias Index
Enter Momentum Bias Index into the indicator search field.
Locate the appropriate indicator and add it to your chart.
Step 4: Review The Indicator
Once added, examine how the indicator behaves relative to price.
Do not immediately begin taking trades.
First learn what the indicator is showing and how its momentum readings correspond with different market conditions.
How To Read The Momentum Bias Index
The most important skill is learning to interpret the indicator in context.
Rather than treating every movement as a buy or sell signal, look for evidence of directional momentum and changes in market bias.
A bullish momentum environment generally suggests that buyers are exerting greater influence over the market.
A bearish momentum environment suggests sellers are exerting greater influence.
But there is another important condition:Momentum Neutrality
Markets frequently enter periods where neither buyers nor sellers have clear control.
These conditions can produce:
- Choppy price action
- False signals
- Whipsaws
- Small directional moves
- Breakouts that quickly fail
One of the biggest mistakes traders make is trying to force a trade when the market does not offer a clear directional advantage.
Sometimes the best trading decision is simply:
Wait.
Momentum Bias + Price Action
The Momentum Bias Index becomes significantly more useful when combined with price action.
For example, suppose GBPUSD is approaching major resistance.
The Momentum Bias Index shows strengthening bullish momentum.
Price then breaks above resistance and begins holding above the breakout level.
Now the trader has multiple pieces of information pointing in the same direction:
Resistance Breakout + Bullish Momentum + Price Confirmation
That is considerably different from buying simply because an indicator changed direction.
The same principle applies to bearish setups.
A trader could look for:
Support Breakdown + Bearish Momentum + Price Confirmation
The objective is to build confluence rather than depend on one signal.
Using The Momentum Bias Index With Trend Direction
Trend identification should come before many trade-entry decisions.
Ask:
What is the larger market structure doing?
An uptrend generally produces:
- Higher highs
- Higher lows
- Bullish price structure
A downtrend generally produces:
- Lower highs
- Lower lows
- Bearish price structure
The Momentum Bias Index can then be used to determine whether momentum supports that broader trend.
Bullish Example
If EURUSD is producing higher highs and higher lows while the Momentum Bias Index confirms bullish momentum, the indicator is supporting the existing trend.
Bearish Example
If USDJPY is producing lower highs and lower lows while momentum confirms bearish conditions, the indicator is supporting the bearish structure.
This creates a simple principle:
Trade with the market structure whenever possible instead of fighting it.
Momentum Bias Index And Moving Averages
Moving averages can provide another layer of confirmation.
A trader might use a moving average to establish trend direction and the Momentum Bias Index to evaluate momentum.
For example:
Price Above Moving Average + Bullish Momentum Bias = Potential Long Confirmation
Or:
Price Below Moving Average + Bearish Momentum Bias = Potential Short Confirmation
This does not guarantee a winning trade.
It simply creates a rules-based framework for determining whether multiple technical factors agree.
Momentum Bias Index And Support & Resistance
Support and resistance remain some of the most important concepts in technical analysis.
Momentum can become particularly valuable when price reaches an important technical level.
Watch for situations where:
- Price approaches support or resistance.
- Price begins showing a potential breakout or rejection.
- Momentum confirms the directional move.
- The trader waits for price confirmation.
- Risk is defined before entering.
This approach can help prevent traders from entering simply because price temporarily moves through a level.
Using Multiple Time Frames
One of the most powerful ways to use a momentum indicator is through multiple-time-frame analysis.
Instead of looking at only one chart, examine the market from a broader perspective.
For example:Higher Time Frame
Use the daily or 4-hour chart to determine the broader trend and directional environment.Intermediate Time Frame
Use the 1-hour chart to identify developing setups.Lower Time Frame
Use the 15-minute or 5-minute chart for more precise trade execution when appropriate.
The objective is alignment.
A trader might see:
Daily: Bullish
4-Hour: Bullish
1-Hour: Bullish Momentum
15-Minute: Bullish Entry Setup
When multiple time frames agree, the trader has greater technical confluence.
A Simple Momentum Bias Forex Trading Strategy
Here is a straightforward framework traders can use when studying the indicator.
Step 1: Identify The Major Trend
Determine whether the currency pair is bullish, bearish, or ranging.
Step 2: Mark Key Technical Levels
Identify important:
- Support
- Resistance
- Previous highs
- Previous lows
- Breakout levels
- Swing points
Step 3: Examine Momentum
Use the Momentum Bias Index to determine whether momentum supports the anticipated direction.
Step 4: Wait For Price Confirmation
Do not enter solely because momentum changes.
Look for price action confirmation.
Step 5: Define Your Risk
Before entering the trade, determine:
- Entry
- Stop-loss
- Target
- Position size
- Maximum acceptable risk
Step 6: Execute The Trade
Only execute when the setup meets your predefined rules.
Step 7: Manage The Position
Once the trade is active, follow your trading plan rather than reacting emotionally to every candle.
Momentum Bias Index Buy Setup
A potential bullish setup could look like this:
1. The higher-time-frame trend is bullish.
2. Price pulls back toward support or another technical area.
3. Selling pressure begins to weaken.
4. The Momentum Bias Index begins supporting bullish momentum.
5. Price produces a bullish confirmation signal.
6. The trader establishes a logical stop-loss.
7. The potential reward justifies the risk.
This creates a structured process rather than an emotional entry.
Momentum Bias Index Sell Setup
A potential bearish setup follows the opposite logic.
1. The broader trend is bearish.
2. Price rallies toward resistance.
3. Buying pressure begins weakening.
4. Momentum shifts toward bearish conditions.
5. Price confirms the bearish move.
6. A logical stop-loss is established.
7. The potential reward justifies the risk.
Again, the indicator is being used as confirmation, not as a standalone prediction machine.
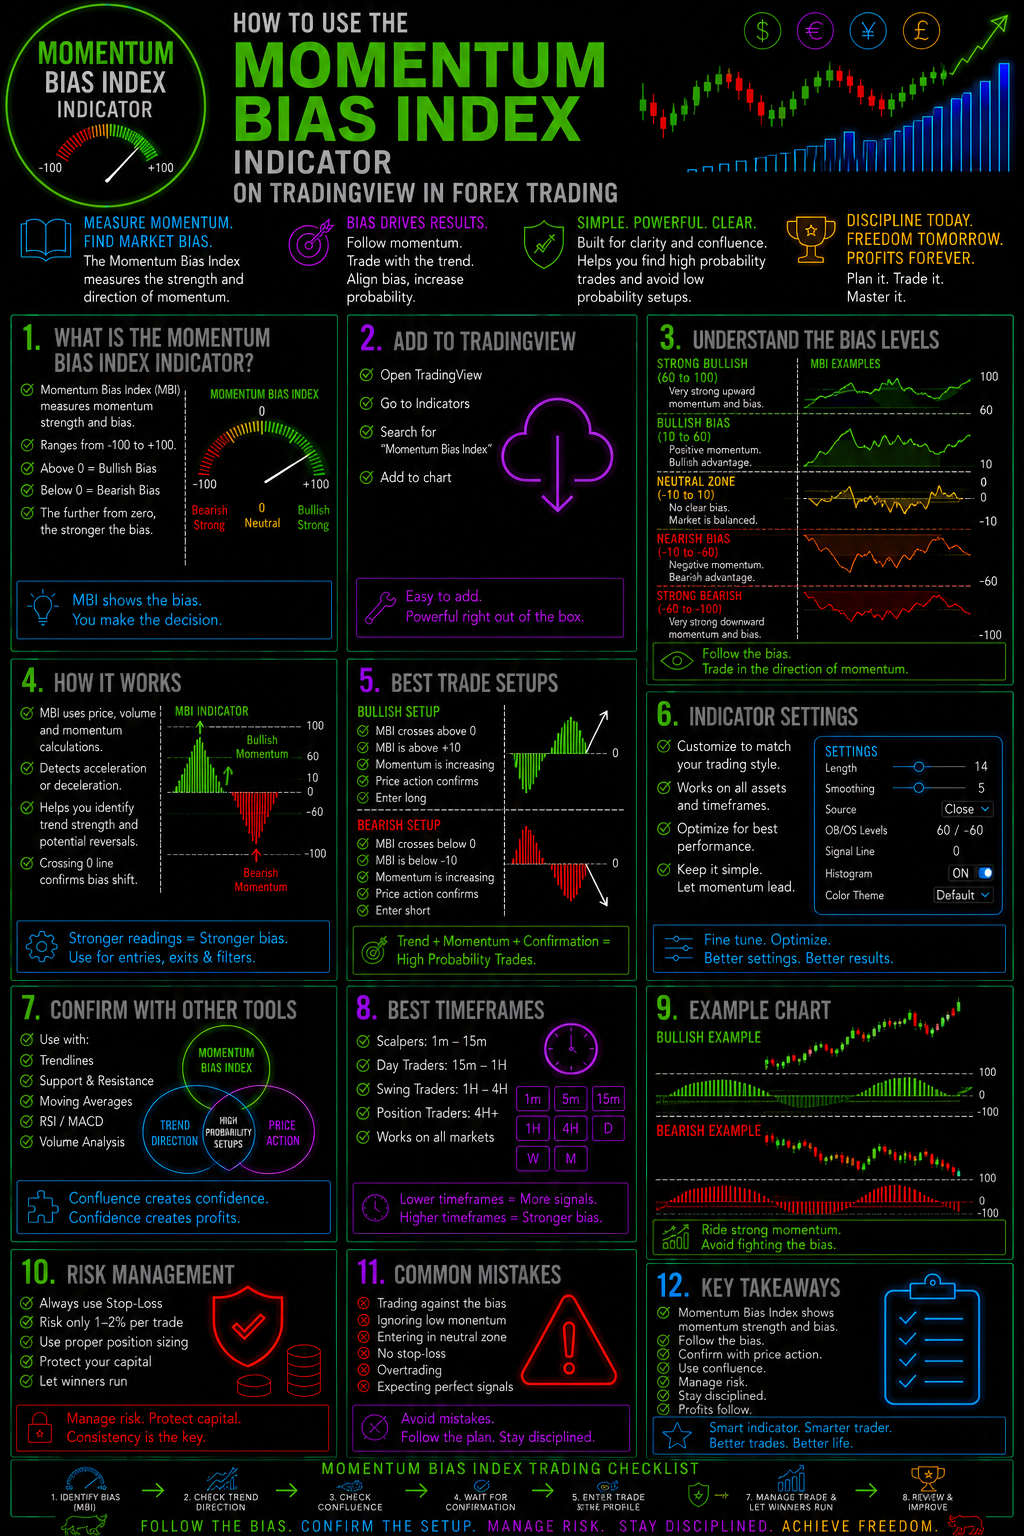
Common Mistakes When Using Momentum Indicators
Mistake #1: Trading Every Signal
More signals do not necessarily mean more profits.
Some signals occur during sideways markets and have little follow-through.
Mistake #2: Ignoring Market Structure
Momentum should not be analyzed in isolation.
Always understand what price is doing.
Mistake #3: Entering Too Early
A momentum shift can occur before price actually confirms a reversal.
Waiting for confirmation can help reduce premature entries.
Mistake #4: Ignoring Higher Time Frames
A bullish signal on a five-minute chart may occur directly against a major daily downtrend.
Context matters.
Mistake #5: No Risk Management
Even excellent technical setups can fail.
Every trade needs predefined risk.
Momentum Does Not Equal A Guaranteed Reversal
This is an important distinction.
A weakening momentum reading does not automatically mean price will reverse.
Markets can experience weakening momentum and then resume the original trend.
Likewise, a strengthening momentum reading does not guarantee that price will continue moving in that direction.
Think of momentum as evidence.
Not certainty.
The strongest trading decisions generally come from combining multiple forms of evidence.
Build A Complete Forex Trading System
The Momentum Bias Index should be viewed as one component of a larger trading system.
A complete technical framework might include:
Market Structure
↓
Trend Direction
↓
Support & Resistance
↓
Momentum
↓
Price Action Confirmation
↓
Trade Entry
↓
Risk Management
↓
Trade Management
This process is much more powerful than randomly searching for buy and sell signals.
Explore More Forex Trading Strategies
If you want to take your technical analysis further, continue exploring the Forex Trading Unlocked educational library.
Learn how different indicators and trading concepts can work together instead of relying on a single technical signal.
Continue Learning:
Forex Trading Strategies
Explore additional approaches to analyzing currency markets and identifying potential trading opportunities.
Technical Analysis
Learn how price action, indicators, chart patterns, momentum, and market structure fit together.
Japanese Candlestick Patterns
Discover how candlestick formations can help identify potential continuation, reversal, and market psychology signals.
MACD Forex Trading Strategy
Learn how MACD can be used to analyze momentum, trend direction, and potential divergence.
Fibonacci Forex Trading
Explore how Fibonacci retracement and extension levels can be incorporated into technical analysis.
Support & Resistance Trading
Learn how important price levels can influence Forex market behavior.
Multi-Time-Frame Forex Trading
Discover how traders can combine higher and lower time frames to improve market context and trade execution.
👉 “Get Instant Access (Check Your Email)”
💥 IMPORTANT: One Last Step Required
After you enter your email, check your inbox (or spam folder) for a confirmation email.
👉 Click the confirmation link so I can send you your free Forex training.
⚠️ If you don’t confirm, I can’t send you anything.
👉 “⚠️ Access expires if not confirmed within 24 hours minutes.”
👉 “Takes 10 seconds. Instant access after email confirmation.”