How To Use The OBV MACD Indicator On TradingView In Forex Trading
What if you could combine price momentum with volume-based market participation to get a clearer picture of what may be happening beneath the surface of a Forex market?
That is where the OBV MACD Indicator can become a powerful addition to a trader's TradingView toolkit.
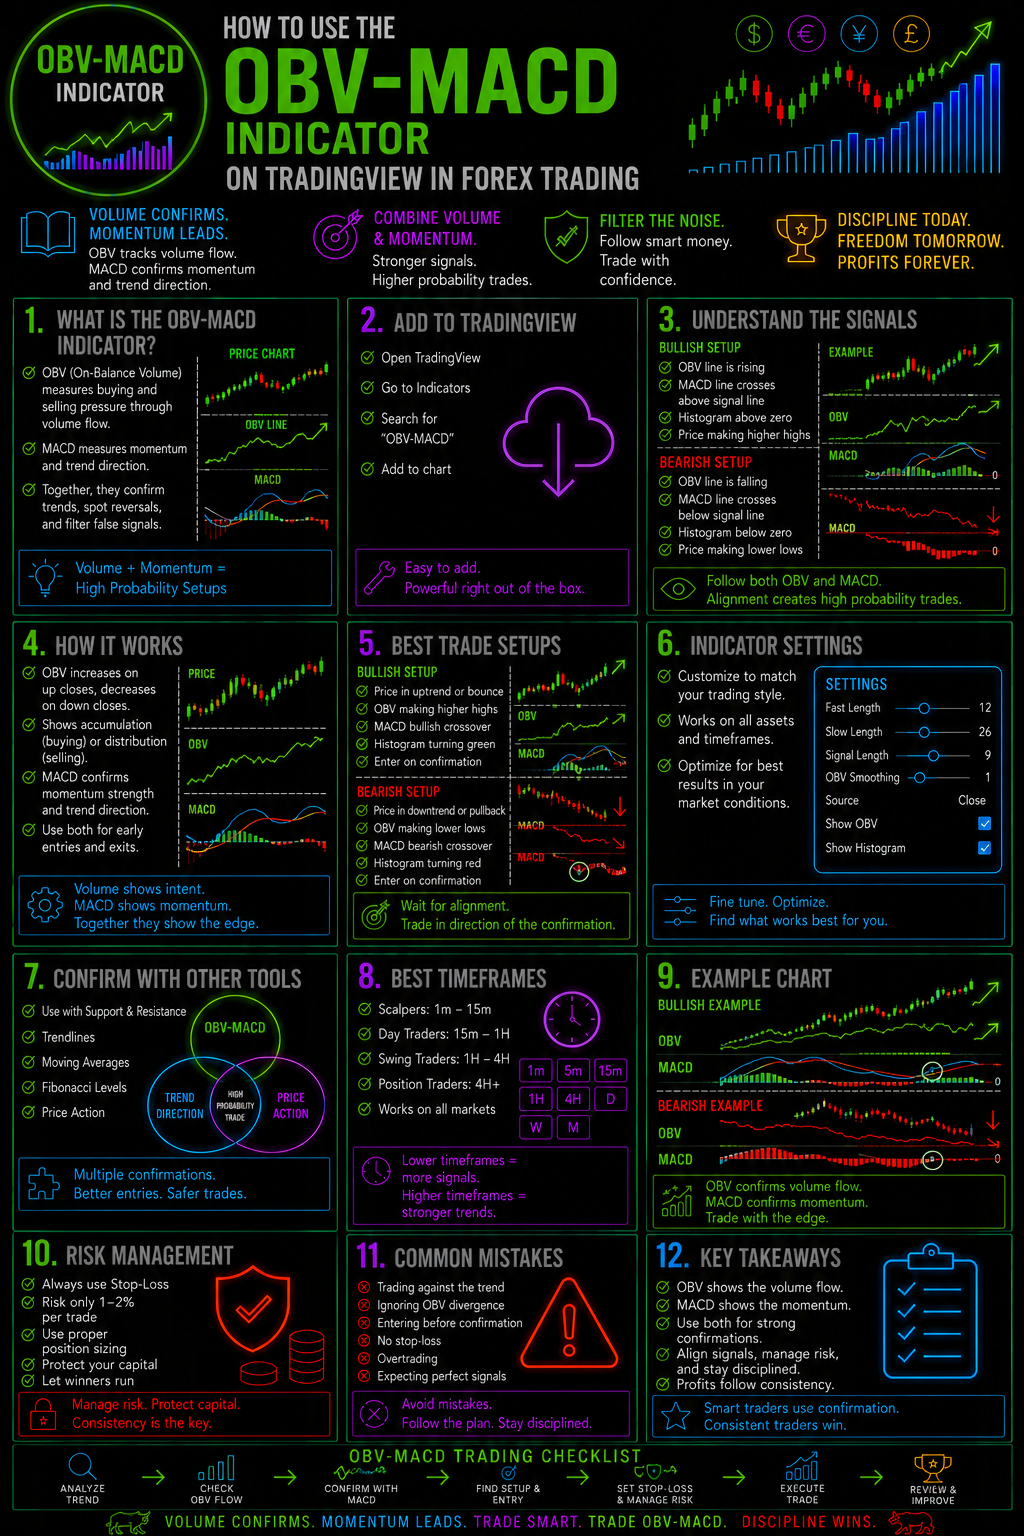
The OBV MACD combines concepts from On-Balance Volume (OBV) and the Moving Average Convergence Divergence (MACD) framework to help traders analyze momentum, directional pressure, trend changes, and potential trading opportunities.
But the real advantage isn't simply putting another indicator on your chart.
It's learning how to interpret what the indicator is telling you—and then combining that information with price action, support and resistance, trend structure, and disciplined risk management.
In this guide, you'll learn how to use the OBV MACD Indicator on TradingView for Forex trading, how to interpret its signals, how to identify potential trend changes, and how to avoid some of the most common mistakes traders make when using momentum indicators.
"Want to learn how professional traders combine indicators with price structure? Explore the FTU Trading Education Library."
What Is The OBV MACD Indicator?
The OBV MACD Indicator brings together two important analytical concepts.On-Balance Volume
OBV attempts to track buying and selling pressure by relating volume to price movement.
When price closes higher, volume is generally added to the OBV calculation. When price closes lower, volume is generally subtracted.
The idea is simple:
Price may tell you what the market is doing. OBV can provide additional information about participation and directional pressure.
MACD
MACD, or Moving Average Convergence Divergence, is one of the most widely used momentum and trend-following indicators.
It can help traders identify:
- Momentum shifts
- Trend direction
- Potential bullish and bearish crossovers
- Changes in momentum strength
- Potential divergences
When these concepts are combined, traders gain another way to study the relationship between market participation and momentum.
Why Use OBV MACD In Forex Trading?
Forex traders constantly face one major problem:
A price move doesn't always tell the entire story.
A currency pair can move sharply in one direction and then reverse.
A trend can appear strong but begin losing momentum.
A breakout can look convincing but fail.
The OBV MACD can provide another layer of information when evaluating these situations.
Instead of asking only:
"Is price going up or down?"
You can begin asking:
"Is momentum supporting this move?"
and:
"Is underlying participation supporting the direction of price?"
That distinction can help traders become more selective.
Get The OBV MACD Indicator Now
How To Add The OBV MACD Indicator To TradingView
Adding the indicator to TradingView is straightforward.
Step 1: Open TradingView
Open your preferred Forex chart on TradingView.
Step 2: Select Indicators
Click the Indicators button at the top of the TradingView chart.
Step 3: Search For OBV MACD
Enter:
OBV MACD
into the indicator search field.
Step 4: Add The Indicator
Select the appropriate OBV MACD indicator and add it to your chart.
Step 5: Adjust The Settings
Depending on the specific version of the indicator you're using, available settings may vary.
Do not automatically assume that changing every setting will improve your results.
Start with the default settings. Learn how the indicator behaves first. Then experiment.
How To Read The OBV MACD Indicator
The most important part of using any indicator isn't adding it to your chart.
It's learning how to interpret it.
When analyzing OBV MACD, focus on several important elements.
1. Momentum Direction
The indicator can help traders identify whether momentum is generally strengthening or weakening.
A strengthening bullish momentum environment may support a long setup.
A strengthening bearish momentum environment may support a short setup.
However, momentum should not automatically be interpreted as a trade signal.
Context matters.
2. Bullish Signals
A bullish OBV MACD configuration can become more interesting when it agrees with the overall market structure.
For example:
Higher Highs + Higher Lows + Bullish Momentum = Stronger Bullish Context
Instead of buying simply because an indicator turns bullish, look for confirmation from price.
Ask:
- Is price above important support?
- Is the market making higher highs?
- Are higher lows forming?
- Is momentum increasing?
- Is resistance nearby?
- Is there room for price to move?
The more pieces that align, the more compelling the setup can become.
3. Bearish Signals
The same principle applies in reverse.
A bearish OBV MACD configuration may become more meaningful when price structure confirms weakness.
For example:
Lower Highs + Lower Lows + Bearish Momentum = Stronger Bearish Context
Look for:
- Price below resistance
- Lower highs
- Lower lows
- Weakening bullish momentum
- Increasing bearish momentum
- Breakdowns from established support
The objective is not to predict every market movement.
The objective is to identify situations where multiple pieces of evidence point in the same direction.
OBV MACD And Divergence
One of the most interesting applications is divergence.
Divergence occurs when price and an indicator aren't moving together.
Bullish Divergence
Price may establish a lower low while the indicator establishes a higher low.
This can suggest that bearish momentum may be weakening.
Bearish Divergence
Price may establish a higher high while the indicator establishes a lower high.
This can suggest that bullish momentum may be weakening.
But remember:
Divergence is a warning—not a guarantee of reversal.
A market can remain overextended longer than expected.
That is why divergence should be combined with price structure and confirmation.
The OBV MACD Forex Trading Strategy
Here's where the indicator becomes much more useful.
Instead of using OBV MACD as a standalone buy-and-sell machine, build a confirmation-based trading process.Step 1 — Identify The Trend
Start with the higher timeframe.
Determine whether the market is:
- Bullish
- Bearish
- Ranging
- Transitioning
Do not begin with the indicator.
Begin with price.
Step 2 — Identify Key Support And Resistance
Mark major:
- Support levels
- Resistance levels
- Previous highs
- Previous lows
- Breakout zones
- Pullback zones
This establishes your trading battlefield.
Step 3 — Wait For Price To Reach An Important Area
Don't chase price in the middle of nowhere.
Wait for the market to reach an area where something meaningful could happen.
Step 4 — Look At OBV MACD
Now examine momentum and participation.
Is the indicator supporting the price movement?
Is momentum increasing?
Is momentum weakening?
Is divergence appearing?
Does the indicator agree with your directional bias?
Step 5 — Look For Price Confirmation
This is critical.
A stronger setup may develop when the indicator agrees with a recognizable price-action signal.
For example:
Support + Bullish Price Action + Bullish OBV MACD = Potential Long Setup
or:
Resistance + Bearish Price Action + Bearish OBV MACD = Potential Short Setup
OBV MACD + Multiple Time Frame Analysis
One of the biggest upgrades a Forex trader can make is learning to stop looking at only one timeframe.
Consider a structure such as:
Daily → 4 Hour → 1 Hour → 15 Minute
The higher timeframe establishes context.
The lower timeframe helps refine execution.
For example:
Daily Chart
Identify the major market direction.
4-Hour Chart
Locate important structural levels.
1-Hour Chart
Look for a developing setup.
15-Minute Chart
Refine the potential entry.
This approach can help prevent traders from taking a bullish signal on a small timeframe when the larger market structure is strongly bearish.
A Powerful OBV MACD Confirmation Framework
Here's a simple framework you can use:MARKET STRUCTURE
Is the market trending?
↓SUPPORT / RESISTANCE
Is price approaching an important level?
↓PRICE ACTION
Is price confirming the setup?
↓OBV MACD
Is momentum supporting the direction?
↓RISK MANAGEMENT
Is the potential reward worth the risk?
↓TRADE EXECUTION
Enter only when your conditions align.
This is far more powerful than simply saying:
"The indicator turned green, so I bought."
OBV MACD Entry Example
Imagine EURUSD is trading inside an established bullish structure.
Price pulls back toward previous support.
You notice:
- Price remains above major support.
- A higher low begins forming.
- Bullish price action develops.
- OBV MACD begins showing improving bullish momentum.
- There is sufficient room before the next major resistance level.
Instead of entering simply because the indicator changed direction, you wait for confirmation.
That creates a confluence-based setup.
And that is the central lesson:
The indicator should support your trading decision—not make the decision for you.
Where Should You Place Your Stop Loss?
No indicator can eliminate risk.
Your stop-loss placement should be based on the structure of the trade.
Depending on the strategy, that may mean placing the stop:
- Below a swing low
- Above a swing high
- Beyond support
- Beyond resistance
- Outside the invalidation point of the setup
The key question isn't:
"How much money can I afford to lose?"
The better question is:
"At what price is my trading idea no longer valid?"
That distinction can dramatically improve risk management.
OBV MACD Risk Management
Even an excellent setup can lose.
That is why position sizing matters.
A basic risk-management framework might include:
Defined Entry + Defined Stop + Defined Risk + Defined Target
Before entering a trade, know:
- Where you enter
- Where you're wrong
- How much you're risking
- Where your target is
- Whether the potential reward justifies the risk
Never allow an indicator to override your risk-management rules.
Common OBV MACD Trading Mistakes
Mistake #1: Trading Every Signal
Indicators can generate signals in both trending and ranging environments.
Not every signal deserves your money.
Mistake #2: Ignoring Market Structure
A bullish indicator signal directly underneath major resistance may not be an attractive long setup.
Context matters.
Mistake #3: Using Too Many Indicators
Adding ten indicators doesn't necessarily produce ten times more information.
It can produce confusion.
Use OBV MACD as part of a structured methodology.
Mistake #4: Ignoring Higher Timeframes
A 5-minute bullish signal can be meaningless when the daily chart is sitting inside a powerful bearish trend.
Always understand the larger picture.
Mistake #5: Chasing Momentum
If price has already made a huge move, entering late because the indicator looks strong can expose you to poor risk/reward.
The best trade is often the trade you don't chase.
"Ready to stop trading random signals? Learn the FTU approach to building high-probability Forex setups."
OBV MACD vs. MACD
Both indicators can be useful, but they approach market analysis from different perspectives.
Feature MACD OBV MACD
Momentum Analysis Yes Yes
Trend Analysis Yes Yes
Volume/Participation Concept Limited Yes
Divergence Analysis Yes Yes
TradingView Compatibility Yes Yes
Forex Application Yes Yes
The important point is not choosing the indicator that sounds more sophisticated.
It's understanding what information the indicator provides and how that information fits into your trading system.
Can OBV MACD Be Used For Scalping?
Yes, it can be incorporated into shorter-term trading approaches.
However, lower timeframes generally contain more market noise.
A signal on a 5-minute chart may be less reliable when it isn't supported by the larger market structure.
For scalpers, OBV MACD can potentially be used as a momentum confirmation tool rather than the sole reason for entering.
Can OBV MACD Be Used For Swing Trading?
Absolutely.
Swing traders may find the indicator useful for identifying:
- Momentum shifts
- Trend continuation
- Potential reversals
- Divergences
- Pullback opportunities
The larger timeframe can also reduce some of the noise found on very short-term charts.
Build Your Trading System—Don't Just Collect Indicators
This is where Forex Trading Unlocked takes a different approach.
Successful trading isn't about collecting indicators.
It's about building a repeatable process.
The OBV MACD can become one component of that process.
Combine it with:
Market Structure
Support & Resistance
Price Action
Momentum
Risk Management
Trade Execution
And suddenly you're no longer asking:
"Does this indicator say BUY?"
You're asking:
"Does this trade meet my complete trading criteria?"
That's a much better question.
Take Your Forex Trading To The Next Level
If you're serious about becoming a more disciplined Forex trader, don't stop with one indicator.
Explore the complete Forex Trading Unlocked library of Forex strategies, TradingView indicators, technical analysis education, market analysis, and trading resources.
[EXPLORE THE FOREX TRADING UNLOCKED TRADING LIBRARY]
Learn the tools. Build the system. Trade with a plan.
Related Forex Trading Resources
Continue building your technical-analysis knowledge with these FTU resources:
TradingView Indicators
How To Use TradingView Indicators In Forex Trading
MACD
How To Use MACD And Divergence In Forex Trading
Fibonacci
How To Use Fibonacci In Forex Trading
Trend Analysis
How To Identify Forex Trends
Support & Resistance
How To Find Support And Resistance In Forex Trading
Risk Management
The Complete Forex Trading Risk Management Guide
Japanese Candlesticks
High Probability Japanese Candlestick Patterns
Multi-Timeframe Trading
How To Use Multiple Time Frame Analysis In Forex Trading
Don't Trade The Indicator. Trade The Setup.
The OBV MACD Indicator can provide valuable information about momentum and market participation.
But the indicator itself isn't the strategy.
Your edge comes from the way you combine information.
Use price structure to establish context.
Use support and resistance to identify important locations.
Use OBV MACD to analyze momentum and participation.
Use price action for confirmation.
Use risk management to control your downside.
Then execute your plan with discipline.
That's how an indicator becomes part of a trading system.
Ready To Go Beyond The Indicator?
Stop searching for random Forex signals. Start building a repeatable trading process.
Forex Trading Unlocked gives you the education, strategies, TradingView tools, market resources, and practical Forex knowledge you need to become a more informed and disciplined trader.
[START EXPLORING FOREX TRADING UNLOCKED]
Your charts are showing you information.
The question is whether you know how to read it.
👉 “Get Instant Access (Check Your Email)”
💥 IMPORTANT: One Last Step Required
After you enter your email, check your inbox (or spam folder) for a confirmation email.
👉 Click the confirmation link so I can send you your free Forex training.
⚠️ If you don’t confirm, I can’t send you anything.
👉 “⚠️ Access expires if not confirmed within 24 hours minutes.”
👉 “Takes 10 seconds. Instant access after email confirmation.”