How to Use the Opening Range Breakout Indicator on TradingView in Forex Trading
Learn to Identify Forex Breakouts, Confirm Momentum, and Build a More Disciplined Trading Strategy
The forex market can move sideways for hours before suddenly breaking into a powerful directional move. The challenge is recognizing when price is breaking out of an important trading range, determining whether the move has staying power, and avoiding false breakouts that trap unprepared traders.
The Opening Range Breakout (ORB) Indicator on TradingView helps traders identify price levels established during a defined opening period and monitor potential breakouts above resistance or below support.
For forex traders, this approach can provide a structured way to analyze market volatility, identify potential trading opportunities, and plan entries with clearly defined risk.
At Forex Trading Unlocked, our goal is to help you move beyond random entries and develop a repeatable trading process built around price action, technical confirmation, and risk management.
Ready to sharpen your trading skills? Learn how the Opening Range Breakout Indicator works, how to configure it on TradingView, and how to combine breakout analysis with a disciplined forex trading plan.
What Is the Opening Range Breakout Indicator?
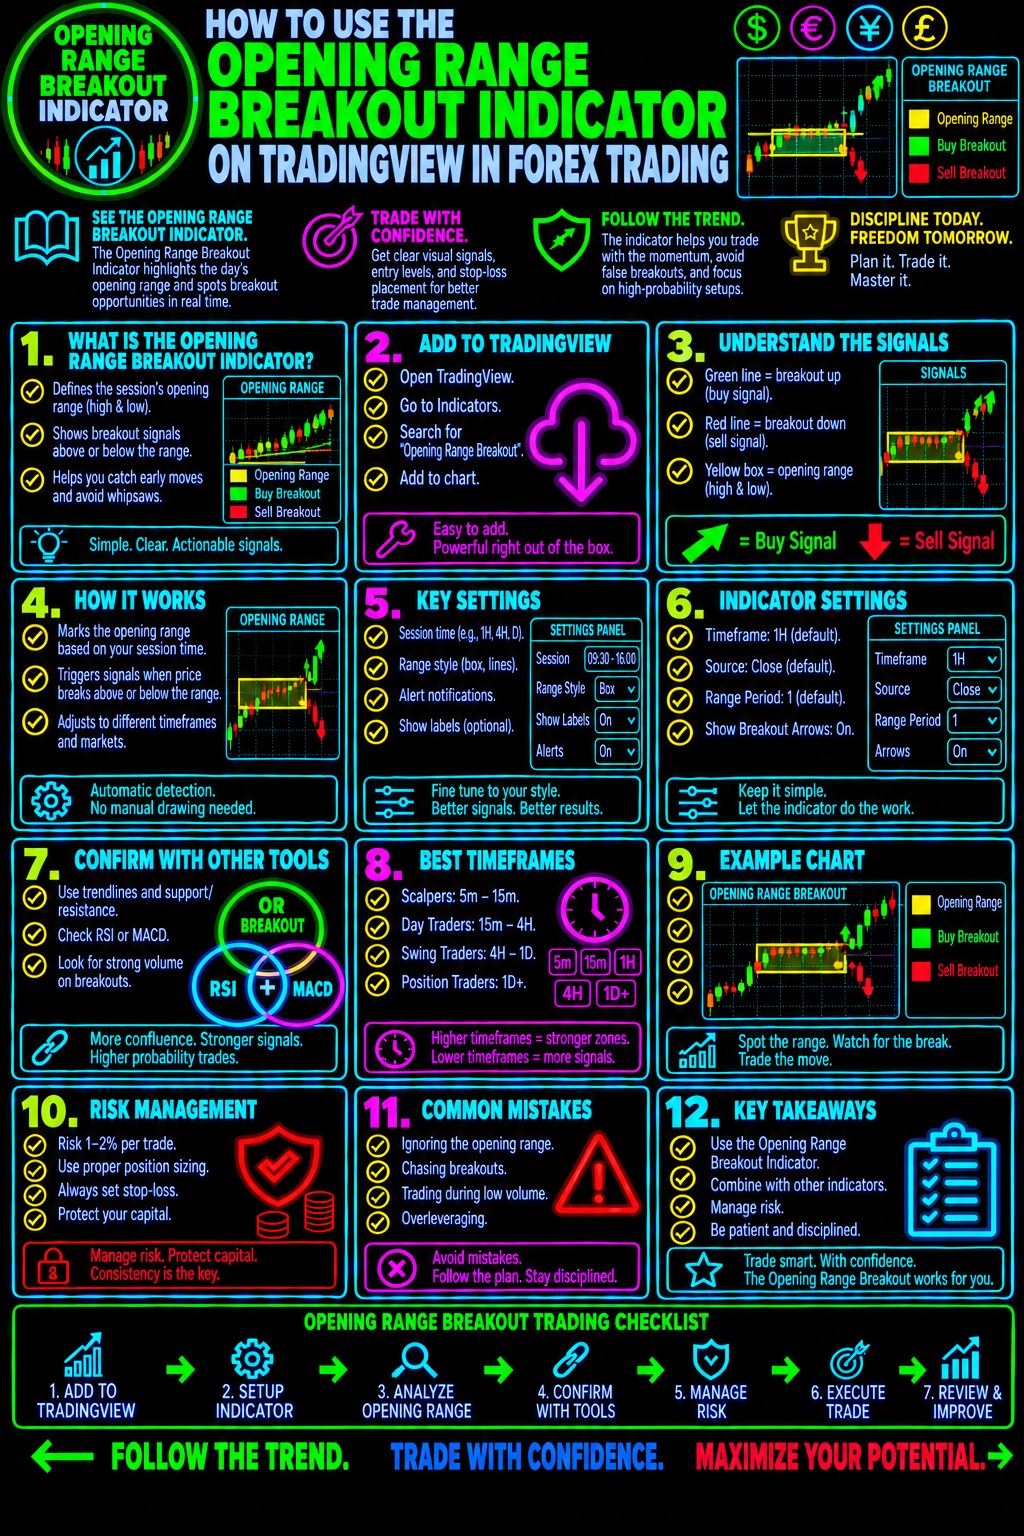
The Opening Range Breakout Indicator identifies the high and low prices established during a specified opening period. These boundaries create a reference range that traders can monitor for potential breakout opportunities.
When price moves above the opening range high, traders watch for a possible bullish breakout. When price moves below the opening range low, traders watch for a possible bearish breakout.
The underlying concept is straightforward: when price escapes a clearly defined range, it may signal a shift in buying or selling pressure.
However, a breakout does not automatically mean a successful trade. Price can briefly move beyond a range and then reverse, creating a false breakout. Traders should look for confirmation, evaluate the broader market environment, and define their risk before entering a position.
The Three Essential ORB Levels
1. Opening Range High
This is the highest price reached during the selected opening period. A move above this level may indicate increasing buying pressure.
2. Opening Range Low
This is the lowest price reached during the selected opening period. A move below this level may indicate increasing selling pressure.
3. Opening Range Boundaries
The area between the high and low creates the opening range. Its width can help traders assess the market's initial volatility and establish potential breakout reference points.
Important: Opening Range Breakout indicators can calculate their ranges differently. Always check the specific TradingView script's settings, session definitions, and calculation rules before trading.
Why Forex Traders Use the Opening Range Breakout Strategy
Forex prices respond to changing liquidity, economic releases, central bank expectations, and the participation of traders across global financial centers.
When an active trading session begins, increased participation can contribute to stronger price movements. Traders use opening-range concepts to identify levels where price may break out of its initial range.
The ORB approach can help you:
- Identify potential bullish and bearish breakout levels.
- Focus on defined price boundaries instead of chasing random movements.
- Develop entry and stop-loss rules before entering a trade.
- Combine price action with trend and momentum confirmation.
- Establish consistent conditions for reviewing and testing a strategy.
- Avoid trading every minor price fluctuation.
The goal is not to predict every market move. It is to identify opportunities that meet your trading rules and reject those that do not.
How to Add the Opening Range Breakout Indicator to TradingView
Follow these steps to begin analyzing opening-range breakouts on TradingView.
Step 1: Open a Forex Chart
Log in to TradingView and open the chart for the currency pair you want to analyze.
Common examples include EURUSD, GBPUSD, USDJPY, and AUDUSD.
Start with a currency pair you understand and can monitor during the relevant trading session.
Step 2: Find the Opening Range Breakout Indicator
Select the Indicators tool on TradingView and search for Opening Range Breakout or ORB.
Several public and community-developed scripts may appear. Their features, calculation methods, session settings, and alerts can differ.
Choose a script that clearly explains its methodology and provides the range levels and breakout information you need. Do not assume every ORB indicator uses identical settings or produces the same signals.
Step 3: Configure the Opening Session
Open the indicator's settings and review its available session options.
Depending on the script, you may be able to configure:
- The opening-range duration.
- The session start and end times.
- The time zone used for calculations.
- The chart time frame.
- Breakout markers and alerts.
- Optional confirmation filters.
For forex trading, session selection deserves particular attention. The forex market operates around the clock during the trading week, unlike an individual stock exchange with a single daily opening bell.
Many forex traders therefore use the London session, the New York session, or a defined period around the New York market open as their reference window.
Do not blindly apply stock-market ORB settings to forex. Confirm the intended session and time zone, and verify how the script defines its opening range.
Step 4: Identify the Opening Range High and Low
Once the indicator has calculated its range, locate the upper and lower boundaries on your chart.
These levels become your breakout reference points.
Before considering a trade, ask yourself:
- Is price approaching the upper or lower boundary?
- Is the opening range unusually narrow or wide?
- Is the broader market trending or consolidating?
- Are major economic announcements approaching?
- Is there enough potential price movement to justify the risk?
These questions help transform an indicator display into a structured trading analysis.
Step 5: Wait for a Potential Breakout
A bullish breakout occurs when price moves above the opening range high. A bearish breakout occurs when price moves below the opening range low.
Some traders enter as soon as price crosses a boundary. Others wait for a candle to close outside the range or look for a subsequent retest.
Neither approach eliminates false breakouts.
For a more disciplined process, define your entry condition in advance. For example, you might require a candle close beyond the range and then assess whether momentum and the broader trend support the move.
Avoid changing your entry rules simply because you fear missing a trade.
Step 6: Plan the Trade Before Entering
Before opening a position, determine your entry price, stop-loss location, potential profit target, and position size.
A stop-loss may be placed beyond a relevant price structure or on the opposite side of a breakout-related level, depending on the strategy and volatility. The appropriate placement must be tested rather than assumed.
Potential profit targets may be based on a risk-to-reward ratio, nearby support and resistance, or another predefined exit method.
If the available reward does not justify the potential risk, skipping the trade is a valid decision.
The Opening Range Breakout Trading Strategy
The following framework provides a starting point for building and testing an ORB strategy. It is an educational example, not a guarantee of profitability.Bullish ORB Setup
A potential bullish setup develops when price breaks above the opening range high.
Trading process:
- Identify the opening range high and low.
- Wait for price to move above the upper boundary.
- Check whether the breakout candle closes above the level if that is part of your rules.
- Assess the broader trend and momentum.
- Identify a logical stop-loss and calculate position size.
- Enter only if the setup meets your predefined risk-to-reward and confirmation requirements.
- Manage the trade according to your written exit rules.
A breakout supported by strong momentum and a favorable market structure may be more compelling than a brief move above resistance followed by an immediate reversal. However, confirmation tools can also produce losing signals.Bearish ORB Setup
A potential bearish setup develops when price breaks below the opening range low.
Trading process:
- Mark the opening range boundaries.
- Wait for price to move below the lower boundary.
- Apply your predefined candle-close or retest condition.
- Check trend direction and selling momentum.
- Define the stop-loss and potential profit target.
- Calculate position size before entry.
- Follow your exit rules without allowing emotions to override the plan.
The key is consistency. A strategy should be evaluated across many trades rather than judged by one successful breakout.
How to Avoid False Opening Range Breakouts
False breakouts are one of the biggest challenges facing ORB traders. Price may cross a range boundary, attract breakout entries, and then reverse back into the range.
Use the following checks to improve your decision-making.
1. Wait for Price Confirmation
A brief wick beyond the range may represent a temporary price probe rather than a sustained breakout.
Depending on your tested strategy, waiting for a candle close beyond the boundary or a successful retest may help filter some premature entries. It may also mean entering later or missing certain moves.
2. Analyze the Overall Trend
A breakout that aligns with the broader trend may offer a different context from one that runs directly into a major opposing price level.
Use higher-time-frame analysis to identify the dominant market structure, relevant support and resistance, and potential obstacles.
3. Check Momentum
Momentum indicators can help assess whether buying or selling pressure is strengthening.
For additional analysis, explore the MACD Indicator, RSI Indicator, and Momentum Trading Strategies available through Forex Trading Unlocked. Use confirmation tools selectively; adding more indicators does not automatically improve a strategy.
4. Be Careful Around Economic News
Major economic releases can trigger sudden price spikes, widening spreads, and sharp reversals.
Before trading a breakout, check the economic calendar and consider whether the upcoming event could make the setup unsuitable for your risk tolerance.
5. Avoid Chasing Extended Moves
If price has already moved far beyond the opening range, the original entry may no longer offer an attractive risk-to-reward profile.
Do not enter merely because the market is moving quickly. Wait for a new setup that meets your criteria.
Best Time Frames for the Opening Range Breakout Strategy
The appropriate chart time frame depends on your trading style, the session you are analyzing, and the duration of the opening range.
1-minute and 5-minute charts: These can reveal short-term breakout activity but may produce more noise, rapid reversals, and trading costs.
15-minute charts: These can help traders assess intraday structure while reducing some of the noise present on very short time frames.
1-hour charts: These can provide broader context for trend direction, support and resistance, and the significance of an intraday breakout.
A practical approach is to use a higher time frame to understand market structure and a lower time frame to evaluate a potential entry.
Make sure the indicator's range calculation is compatible with your chosen chart. Changing time frames can affect how the range and signals are displayed, depending on the script.
Which Forex Sessions Work Best for ORB Trading?
The London and New York sessions often attract significant forex trading activity, making them useful periods to investigate for opening-range strategies.
London Session
The London session is important for major European currency pairs, including EURUSD and GBPUSD. Traders may monitor a defined period around the session's start to identify potential range breaks.
New York Session
The New York session is particularly relevant for USD-related pairs. The overlap between London and New York can provide substantial activity, although volatility and liquidity vary by day and market conditions.
Choosing Your Session
There is no universally best session or opening-range duration for every currency pair.
Select a consistent session, define its time zone correctly, and test your rules across different market conditions. Account for daylight-saving changes where relevant.
Combine ORB With Other TradingView Indicators
The Opening Range Breakout Indicator identifies important price boundaries, but it does not provide a complete trading plan by itself.
Combining it with carefully selected tools can help you assess the market from several perspectives.
ORB + Moving Averages
Moving averages can provide a simple view of trend direction. A bullish breakout above the opening range may deserve closer examination when price structure and the selected moving average also support an upward trend.
Learn more in our Moving Average Forex Trading Strategy.
ORB + RSI
The Relative Strength Index measures the speed and magnitude of recent price changes. It can help traders examine momentum conditions and potential divergences.
RSI should not be used as a simple rule that automatically rejects every overbought or oversold breakout. Strong trends can remain overbought or oversold for extended periods.
Read our RSI Indicator Forex Trading Guide for more information.
ORB + Support and Resistance
Support and resistance analysis helps identify price areas where a breakout may encounter opposing pressure.
For example, a bullish breakout that runs directly into a major resistance level may offer less room for a trade than one with clear space to the next significant level.
Explore our Support and Resistance Forex Trading Strategy to strengthen your price-action analysis.
Keep your chart focused. Start with the opening range and one or two complementary tools. Add another indicator only when it serves a specific purpose in your trading rules.
Opening Range Breakout Risk Management
Even a well-planned breakout strategy can experience losing trades. Risk management determines how much those losses affect your trading account.
Define Your Risk Before Entry
Decide how much of your account you are willing to risk on an individual trade. Some traders use a small fixed percentage, such as 1%, as a planning guideline, but the appropriate amount depends on individual circumstances and risk tolerance.
Calculate Position Size
Position size should reflect the distance between your entry and stop-loss, the value of a pip for the currency pair, and your chosen account-risk limit.
A wider stop generally requires a smaller position to maintain the same monetary risk.
Establish a Realistic Profit Target
Do not assume every breakout will deliver a large directional move. Define your target using a tested rule and consider the next meaningful support or resistance level.
Include Trading Costs
Spreads, commissions, and slippage can significantly affect short-term breakout strategies. Include them in your testing, particularly when using low time frames or trading around major announcements.
Test Before Trading Live
Use TradingView's historical charts and, where suitable, its strategy-testing tools to evaluate your approach. If the indicator is not a backtestable strategy, you may need a separate method for recording and evaluating its signals.
Track win rate, average win, average loss, maximum drawdown, trading costs, and results across different market conditions.
A visually attractive chart is not evidence of a profitable strategy.
Build your foundation with our Forex Risk Management Guide before increasing position size or committing significant capital.
Common Opening Range Breakout Trading Mistakes
Avoid these frequent errors when developing your ORB strategy.
- Entering every breakout: Not every move beyond the range is worth trading.
- Ignoring the session time: Incorrect time-zone settings can produce an opening range that does not match your intended trading period.
- Changing rules after a loss: Inconsistent decisions make it difficult to evaluate a strategy objectively.
- Using excessive leverage: A small adverse move can cause a disproportionate loss when leverage is too high.
- Ignoring economic announcements: News-related volatility can invalidate assumptions about normal market conditions.
- Adding too many indicators: Conflicting signals can create confusion instead of clarity.
- Failing to keep records: Without a trade journal, it is difficult to identify which conditions help or hurt performance.
The solution is a written trading plan, a repeatable setup, and honest evaluation of the results.
Develop a Complete Forex Trading Plan
The Opening Range Breakout Indicator is one component of a broader trading process. Consistent traders need to understand market structure, technical confirmation, position sizing, and the psychological challenges of executing a plan.
Forex Trading Unlocked provides educational resources to help you develop these skills.
Continue building your knowledge with these related topics:
- Forex Trading for Beginners: Understand currency pairs, pips, spreads, leverage, and the mechanics of the forex market.
- High-Probability Japanese Candlestick Patterns: Learn how candlestick formations can help you interpret price action around important breakout levels.
- Forex Trading Strategies: Explore structured approaches to identifying entries, exits, and potential opportunities.
- Forex Risk Management: Learn how position sizing and predefined risk limits fit into a trading plan.
- Trading Psychology: Develop the discipline to follow your rules instead of reacting emotionally to market movements.
- TradingView Forex Indicators: Discover additional technical tools for analyzing trend, momentum, and market structure.
The more clearly you understand each part of the process, the easier it becomes to evaluate a setup without relying on a single indicator.
Take the Next Step Toward Better Forex Trading
You do not need dozens of indicators to build a structured trading approach. You need a clear method for identifying opportunities, evaluating confirmation, managing risk, and learning from your results.
The Opening Range Breakout Indicator gives you a framework for monitoring price as it moves beyond a defined range. Your job is to determine when that movement meets your trading criteria—and when it is better to stay out of the market.
At Forex Trading Unlocked, we help traders build that foundation through practical forex education, technical-analysis guides, trading strategies, and risk-management resources.
Get Your Free Forex Trading Starter Kit
Ready to take your trading knowledge further?
Get the Free Forex Trading Starter Kit from Forex Trading Unlocked and start building a more structured approach to analyzing the forex market.
Learn the fundamentals, strengthen your trading process, and discover the educational resources available to help you move forward.
Get Your Free Forex Trading Starter Kit
Continue learning. Build your plan. Protect your capital.
Risk Disclosure: Forex trading involves substantial risk and is not suitable for every investor. Leverage can magnify both gains and losses. Technical indicators are analytical tools, not guarantees of future performance. Test any strategy carefully and never risk money you cannot afford to lose.
This is a Text Block, inside a Container, for your content. Note that all Containers on this page are set to 66%. Click on the Width menu and select the width you want.
Lorem ipsum dolor sit amet, consectetur adipiscing elit. Sed ac turpis eget eros congue condimentum. Pellentesque nunc erat, gravida eu bibendum vel, vestibulum eu nisi. Fusce sollicitudin est et arcu commodo ut imperdiet magna pellentesque. Etiam commodo luctus volutpat.
Etiam pretium arcu eu nunc interdum in volutpat nisi ornare. Fusce nec dolor orci. Aenean faucibus rutrum tortor vitae lobortis. Nunc iaculis neque et enim rutrum ornare. Quisque viverra rutrum metus, ut lobortis augue lacinia ut. Vestibulum felis augue, fringilla et aliquam a, dignissim ac sapien. Cras eu sem vel massa scelerisque aliquet.
Stripe 1 — subheadline

A Text/Image Block.
Integer libero quam, hendrerit ullamcorper tempus sed, convallis at turpis.
Donec sollicitudin nulla quis felis auctor ut vulputate erat pellentesque. Fusce eget commodo ipsum. Praesent quis fringilla turpis. Maecenas quam tortor, dapibus eget mollis et, facilisis at mi. Aenean non risus non velit placerat pretium. Donec vehicula faucibus diam, vitae tempus arcu porttitor non.
Nam sit amet mauris id sem rhoncus placerat a ac nibh. Donec fermentum mauris eget ligula faucibus rutrum. Nullam dolor nisi, congue sed blandit elementum, porta nec velit. Quisque nec adipiscing tortor. Integer auctor laoreet laoreet. Cras non ultricies mauris. Cum sociis natoque penatibus et magnis dis parturient montes, nascetur ridiculus mus. Curabitur quis sem vitae felis pulvinar condimentum nec nec neque.
A Container with the Callout Box preset.
Great for drawing attention.
Simple Text Block inside a Container.
Lorem ipsum dolor sit amet, consectetur adipiscing elit. Sed ac turpis eget eros congue condimentum. Pellentesque nunc erat, gravida eu bibendum vel, vestibulum eu nisi.
Fusce sollicitudin est et arcu commodo ut imperdiet magna pellentesque. Etiam commodo luctus volutpat. Etiam pretium arcu eu nunc interdum in volutpat nisi ornare. Fusce nec dolor orci. Aenean faucibus rutrum tortor vitae lobortis. Nunc iaculis neque et enim rutrum ornare. Quisque viverra rutrum metus, ut lobortis augue lacinia ut. Vestibulum felis augue, fringilla et aliquam a, dignissim ac sapien. Cras eu sem vel massa scelerisque aliquet.
Stripe 2 — SubHeadline
This is a Text/Image Block.
Lorem ipsum dolor sit amet, consectetur adipiscing elit. Sed ac turpis eget eros congue condimentum. Pellentesque nunc erat, gravida eu bibendum vel, vestibulum eu nisi.
Etiam pretium arcu eu nunc interdum in volutpat nisi ornare. Fusce nec dolor orci. Aenean faucibus rutrum tortor vitae lobortis. Nunc iaculis neque et enim rutrum ornare. Quisque viverra rutrum metus, ut lobortis augue lacinia ut. Vestibulum felis augue, fringilla et aliquam a, dignissim ac sapien. Cras eu sem vel massa scelerisque aliquet.
A Text Block inside a Container.
Integer libero quam, hendrerit ullamcorper tempus sed, convallis at turpis. Donec sollicitudin nulla quis felis auctor ut vulputate erat pellentesque. Fusce eget commodo ipsum.
Stripe 3 — Subheadline
A Text/Image Block. Praesent quis fringilla turpis. Maecenas quam tortor, dapibus eget mollis et, facilisis at mi. Aenean non risus non velit placerat pretium. Donec vehicula faucibus diam, vitae tempus arcu porttitor non. Nam sit amet mauris id sem rhoncus placerat a ac nibh. Donec fermentum mauris eget ligula faucibus rutrum. Nullam dolor nisi, congue sed blandit elementum, porta nec velit. Quisque nec adipiscing tortor. Integer auctor laoreet laoreet. Cras non ultricies mauris. Cum sociis natoque penatibus et magnis dis parturient montes, nascetur ridiculus mus. Curabitur quis sem vitae felis pulvinar condimentum nec nec neque.
👉 “Get Instant Access (Check Your Email)”
💥 IMPORTANT: One Last Step Required
After you enter your email, check your inbox (or spam folder) for a confirmation email.
👉 Click the confirmation link so I can send you your free Forex training.
⚠️ If you don’t confirm, I can’t send you anything.
👉 “⚠️ Access expires if not confirmed within 24 hours minutes.”
👉 “Takes 10 seconds. Instant access after email confirmation.”