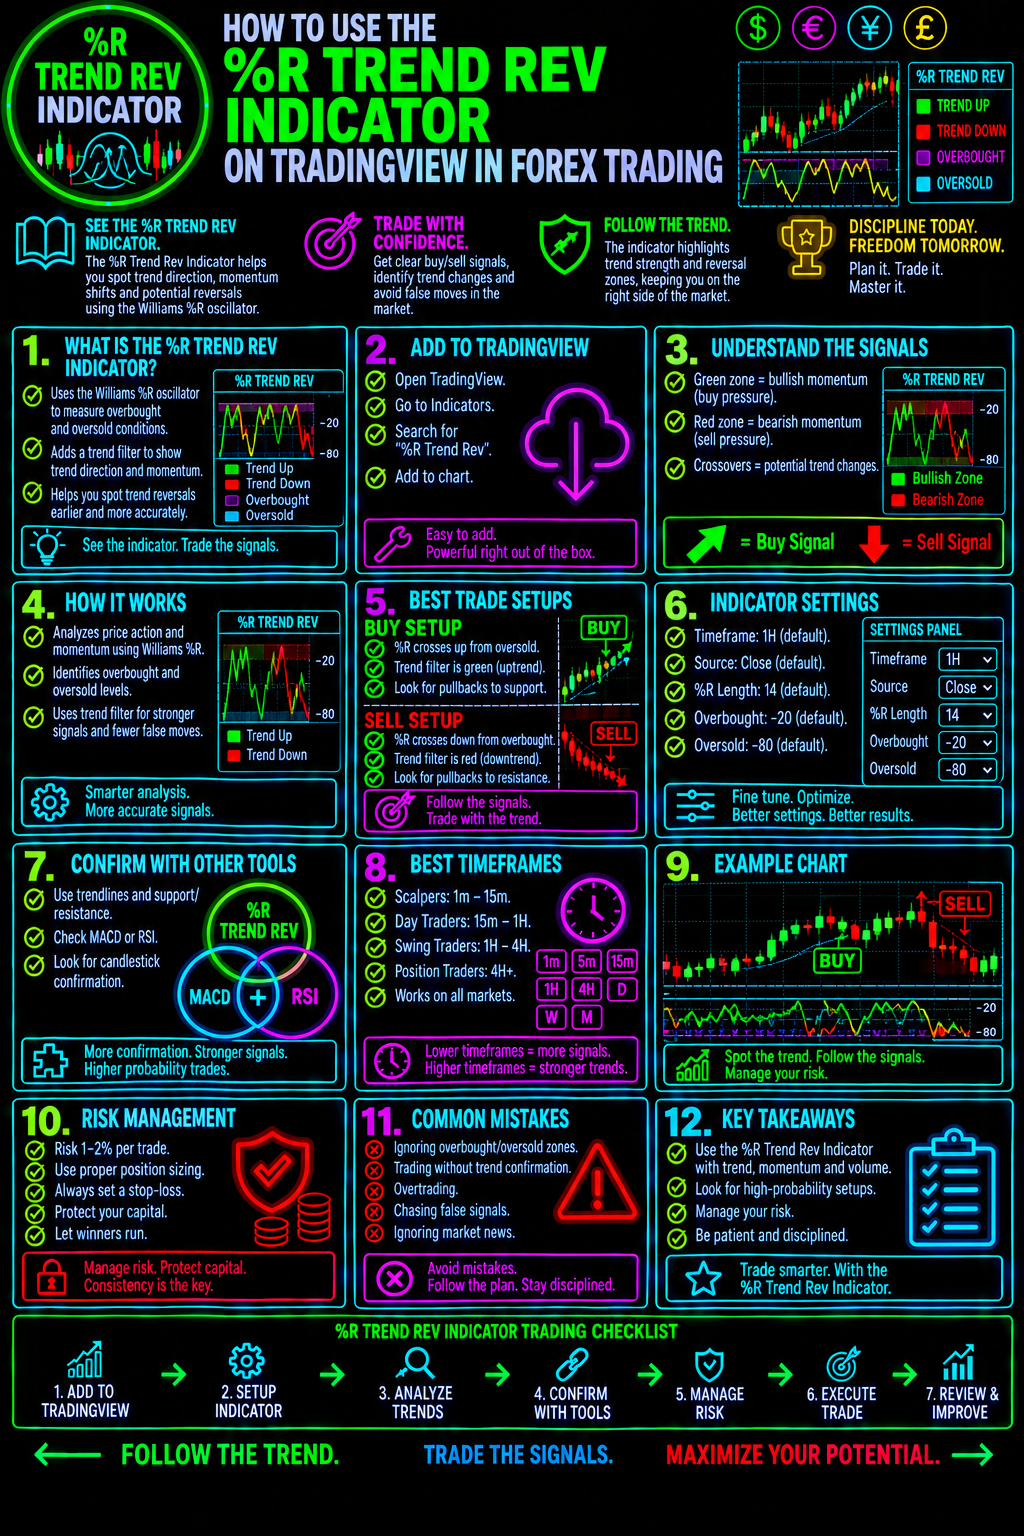
How To Use The %R Trend Rev Indicator On TradingView In Forex Trading
Discover Potential Forex Trend Reversals With The %R Trend Rev Indicator
Are you entering Forex trades too late, missing potential trend reversals, or getting caught on the wrong side of a changing market?
Successful Forex trading requires more than simply identifying whether a currency pair is moving higher or lower. Traders must also recognize when momentum may be weakening, when market direction could be changing, and when a potential trading opportunity deserves closer attention.
The %R Trend Rev Indicator on TradingView is a technical analysis tool designed to help traders evaluate market momentum and identify potential trend reversal conditions. When incorporated into a structured Forex trading strategy, this indicator can help you analyze changing market conditions and search for opportunities to improve your trade timing.
However, no indicator can predict every market reversal accurately. The objective is to combine indicator signals with price action, trend analysis, support and resistance, and disciplined risk management.
At Forex Trading Unlocked, our goal is to help you develop a more informed, systematic approach to trading the foreign exchange market.
Want to improve your Forex trading skills? Start with our Forex Trading Guide and discover how technical analysis can help you make more informed trading decisions.
What Is The %R Trend Rev Indicator?
The %R Trend Rev Indicator is a TradingView charting tool intended to help traders identify conditions that may indicate a shift in market direction.
The name suggests a relationship to Williams %R, a momentum oscillator developed by Larry Williams. Traditional Williams %R measures the relationship between a closing price and the high-low range over a specified lookback period.
Williams %R generally moves between 0 and -100:
- Readings near 0 indicate that price is closing near the upper end of its recent range.
- Readings near -100 indicate that price is closing near the lower end of its recent range.
- Readings near -20 are traditionally associated with overbought conditions.
- Readings near -80 are traditionally associated with oversold conditions.
These readings do not automatically predict a reversal. Strong Forex trends can remain overbought or oversold for extended periods.
Important: The exact calculations, signal rules, and settings of the specific %R Trend Rev script may differ from the standard Williams %R oscillator. Review the indicator's TradingView description and available settings before applying a trading strategy.
The objective is to understand what the indicator actually measures, how its signals develop, and whether those signals agree with the broader market structure.
Why Forex Traders Should Study Trend Reversals
Currency markets move through different phases. A currency pair may establish a sustained trend, consolidate within a range, accelerate in one direction, or begin losing momentum before a possible reversal.
Recognizing these transitions can help traders avoid treating every price movement as a trading opportunity.
The %R Trend Rev Indicator may be useful when investigating three important market conditions.1. Potential Bullish Trend Reversals
A bullish reversal occurs when a market that has been declining begins showing evidence of a possible move higher.
Traders can investigate whether a bullish indicator signal appears near an established support zone, a previous swing low, or an area where selling pressure appears to be weakening.
Look for additional evidence, such as:
- Price forming a higher low.
- A bullish candlestick reversal pattern.
- Price reclaiming a previous resistance level.
- Improving momentum following a period of selling pressure.
A bullish signal becomes more interesting when it agrees with the price chart. It is not, by itself, a guarantee that a new uptrend will develop.
2. Potential Bearish Trend Reversals
A bearish reversal occurs when an advancing market begins showing evidence of a possible move lower.
Rather than selling solely because an indicator enters an overbought region, examine whether price is approaching resistance, momentum is weakening, or a bearish price structure is developing.
Potential confirmation factors include:
- Price forming a lower high.
- A bearish candlestick reversal pattern.
- A breakdown below a previous support level.
- Failure to sustain a breakout above resistance.
Combining these observations can help you evaluate whether a bearish signal deserves further consideration.
3. Changes In Momentum During An Existing Trend
Not every momentum shift produces a complete trend reversal.
Sometimes a currency pair pauses, retraces, or consolidates before continuing in its original direction. This distinction matters because traders who mistake every pullback for a reversal may enter prematurely or exit a valid position too soon.
Use the indicator as one source of information while evaluating the prevailing trend, important price levels, and the market's overall structure.
How To Add The %R Trend Rev Indicator To TradingView
TradingView provides charting tools that allow Forex traders to study price action and apply technical indicators.
Follow these steps to locate and evaluate the %R Trend Rev Indicator.
- Open TradingView. Visit TradingView and open a Forex chart.
- Select a currency pair. Consider a major pair such as EUR/USD, GBP/USD, or USD/JPY.
- Open the Indicators menu. Use TradingView's indicator search to look for “%R Trend Rev.”
- Verify the correct script. Review the available description and author information. If multiple scripts have similar names, confirm that you have selected the intended indicator.
- Add the indicator to your chart. Follow the script's instructions and examine how its signals or plotted values appear.
- Review the settings. Check the available parameters and determine how they affect the indicator's output.
- Observe historical signals. Compare previous indicator readings with the price movements that followed them.
Some TradingView scripts are publicly available, while others may require access permission or a subscription. Availability and features can vary.
Do not assume that a script uses standard Williams %R calculations simply because its name contains “%R.” Verify its actual methodology before making trading decisions.
How To Read The %R Trend Rev Indicator In Forex Trading
The first step in learning any indicator is understanding what its signals mean.
Depending on the specific script, the %R Trend Rev Indicator may present information through colored lines, plotted signals, oscillator values, labels, or other visual elements. Interpret these features according to the indicator's documentation rather than assuming that every version uses identical rules.
Step 1: Establish The Existing Market Trend
Before interpreting a potential reversal signal, determine whether the currency pair is trending upward, trending downward, or moving sideways.
A basic trend analysis can help:
- An uptrend generally produces higher highs and higher lows.
- A downtrend generally produces lower highs and lower lows.
- A ranging market generally moves between identifiable support and resistance zones.
Consider using a higher timeframe to establish the broader market direction before examining lower-timeframe entries.
Step 2: Identify A Potential Reversal Signal
Watch for a change in the indicator's displayed condition that its documentation identifies as a possible reversal.
Do not enter a trade simply because a signal appears. First determine where it occurs relative to the prevailing trend, recent swing points, and nearby support or resistance.
A signal near an important price level may deserve more attention than an identical signal appearing in the middle of an uncertain trading range.
Step 3: Wait For Price Confirmation
Price confirmation can help distinguish a developing opportunity from a signal that fails to produce a meaningful market move.
Depending on the trading strategy, confirmation might involve a break of market structure, a candlestick pattern, or a close beyond a key price level.
For example, a potential bullish reversal may become more compelling if price establishes a higher low and then closes above a nearby swing high.
The key is consistency. Define your confirmation rules before entering the market rather than changing them to justify a trade.
Step 4: Identify Your Entry, Stop-Loss, And Profit Target
Every trade should have a clear plan before capital is placed at risk.
Determine:
- Entry: The price condition that must occur before entering.
- Stop-loss: The price level at which the trade thesis is considered invalid.
- Profit target: The level at which you plan to take profits, based on your strategy.
- Position size: The number of units or lots that fits your risk limit.
A visually appealing indicator signal is not sufficient reason to ignore a poor risk-to-reward profile.
Step 5: Record And Evaluate The Results
Track the indicator's signals across different currency pairs, timeframes, and market environments.
Record whether each signal occurred during a strong trend, a ranging market, or a period of elevated volatility. Include transaction costs, stop-loss outcomes, and the trading rules used.
This process helps you determine whether the indicator adds measurable value to your existing strategy.
The Best Way To Combine %R Trend Reversals With Price Action
One of the most common mistakes in Forex trading is relying on a single indicator to make every trading decision.
A more structured approach combines several independent forms of technical evidence.
Combine The Indicator With Support And Resistance
Support and resistance levels help identify areas where price has previously encountered buying or selling pressure.
A potential reversal signal near a well-defined support zone may warrant investigating a bullish setup. A similar signal near established resistance may warrant investigating a bearish setup.
However, support and resistance levels can break. Always define the price action that would invalidate your analysis.
Learn more in our Forex Support And Resistance Trading Guide.
Combine The Indicator With Japanese Candlestick Patterns
Candlestick patterns provide information about price behavior within a specific period.
Patterns such as the hammer, shooting star, bullish engulfing, and bearish engulfing can help traders evaluate whether buying or selling pressure may be changing.
When a documented %R Trend Rev signal coincides with a relevant candlestick pattern at an important price level, you have multiple factors to investigate instead of relying on an isolated indicator reading.
Study these patterns in our High Probability Japanese Candlestick Patterns Guide.
Combine The Indicator With Trend Analysis
A reversal signal against the prevailing trend may represent an early change in direction, but it may also be a temporary pullback.
Trend analysis helps you distinguish between a possible countertrend trade and a potential transition into a new trend.
You can also study trend-following tools on TradingView and compare their behavior with the %R Trend Rev Indicator. Use only combinations that have a clear purpose and can be tested objectively.
Explore our Forex Trading Education for additional technical analysis concepts.
Combine The Indicator With Momentum Analysis
Momentum tools can provide a second perspective on whether price movement is strengthening or weakening.
For example, traders may examine the Relative Strength Index (RSI) or Moving Average Convergence Divergence (MACD) alongside a reversal signal.
Avoid adding indicators simply to accumulate confirmations. Two tools that measure essentially the same underlying condition may provide less independent information than they appear to.
Your objective is a repeatable trading process, not a chart crowded with indicators.
A Practical %R Trend Rev Forex Trading Strategy
The following framework illustrates how to evaluate a potential reversal opportunity. It is a strategy-development template, not a claim about the exact rules of the specific TradingView script.
Bullish Setup
Market condition: EURUSD has been declining and approaches a previously identified support zone.
Indicator observation: The %R Trend Rev Indicator displays a condition that its documentation identifies as potentially bullish.
Price confirmation: Price forms a higher low and subsequently closes above a nearby short-term swing high.
Trade planning: Establish a potential entry according to your predefined rules. Place the stop-loss at a level that invalidates the setup, allowing for realistic market volatility.
Profit objective: Identify a reasonable target using the next resistance zone or a predefined reward-to-risk multiple.
Risk control: Calculate position size from the distance between the entry and stop-loss. Skip the trade if the potential reward does not justify the risk.
Bearish Setup
Market condition: GBPUSD advances into an established resistance zone.
Indicator observation: The indicator displays a condition that its documentation identifies as potentially bearish.
Price confirmation: Price fails to sustain its advance and breaks below a nearby short-term swing low.
Trade planning: Define the entry conditions, stop-loss, and profit objective before entering.
Risk control: Ensure that the planned position size fits your predetermined risk limit and that the setup remains attractive after accounting for transaction costs.
When You Should Avoid A Trade
A professional trading process includes knowing when to stay out of the market.
Consider avoiding a setup when:
- The indicator signal is unclear or contradicts your documented rules.
- Price is moving erratically without a recognizable structure.
- The stop-loss would need to be excessively wide.
- The potential profit does not justify the risk.
- A major economic announcement could produce volatility that your strategy is not designed to handle.
- You have not tested the setup sufficiently to understand its limitations.
The goal is not to trade every signal. The goal is to identify opportunities that meet your predefined standards.
Which Forex Timeframe Should You Use?
The best timeframe depends on your trading style, the indicator's behavior, and the strategy you intend to test.
Trading style Timeframes to investigate Main consideration
Scalping 1-minute to 5-minute Fast signals, spread, execution costs, and market noise
Intraday trading 5-minute to 15-minute Short-term price structure and session volatility
Swing trading 1-hour to 4-hour Larger price swings and confirmation of market structure
Position trading Daily to weekly Broader trends and longer-term market conditions
These are starting points for research, not recommended settings for every trader.
Lower timeframes may produce more signals and greater sensitivity to short-term fluctuations. Higher timeframes may produce fewer signals but require wider stops and greater patience.
Test the indicator on your intended timeframe and evaluate how its signals behave under different market conditions.
How To Manage Risk When Trading Trend Reversals
Trend reversals can be difficult to trade because the market may continue in its existing direction even after momentum begins to change.
Risk management is therefore essential.
Define Your Risk Before Entering
Many traders use a small, predetermined percentage of account equity as their maximum planned loss on an individual trade. A 1% risk limit is one example, not a guarantee of safety or a universally suitable amount.
For a $10,000 account, a 1% planned risk equals $100 before allowing for slippage, commissions, and other execution costs.
Position size should reflect the stop-loss distance and the value of each price movement for the currency pair being traded.
Never Move A Stop-Loss Just To Avoid A Loss
If price invalidates your trading thesis, follow your plan. Widening a stop-loss without a predefined rule can turn a manageable loss into a much larger one.
Test Before Trading Live
Use historical chart review and, where available, systematic backtesting to assess the strategy.
Account for repainting or changing historical signals, transaction costs, and differences between simulated and real execution. Forward-test the rules on a demo account before considering live capital.
For a deeper understanding of protecting your trading capital, explore our Forex Trading Guide and study how position sizing, stop-loss placement, and risk-to-reward analysis work together.
Common Mistakes When Using The %R Trend Rev Indicator
Even a useful technical indicator can produce poor results when applied without a clear trading plan.
Mistake 1: Treating every signal as a trade.
Signals identify conditions to investigate. They do not guarantee that price will reverse.
Mistake 2: Confusing an overbought or oversold reading with an imminent reversal.
Strong trends can remain at extreme oscillator readings for extended periods.
Mistake 3: Ignoring the broader market structure.
A potential reversal signal may have little value if it occurs in an unfavorable location or conflicts with the strategy's rules.
Mistake 4: Using too many indicators.
Overloading a chart can create confusion and redundant confirmations. Select tools that contribute distinct information.
Mistake 5: Ignoring economic events.
Interest-rate decisions, inflation reports, employment releases, and central-bank communications can cause rapid currency movements.
Mistake 6: Failing to maintain a trading journal.
Without recording your results, it becomes difficult to determine whether an indicator improves your decision-making or merely looks convincing on selected charts.
Avoiding these mistakes can help you build a more disciplined approach to technical analysis.
How To Test The %R Trend Rev Indicator Before Risking Money
Before using the indicator in a live Forex strategy, create a repeatable testing process.
- Select one or two currency pairs.
- Choose the timeframe you intend to trade.
- Read the indicator's documentation and record the signal rules.
- Define your entry, confirmation, stop-loss, and exit criteria.
- Review a meaningful sample of historical setups, including losing trades.
- Account for spreads, commissions, slippage, and other trading costs.
- Record win rate, average win, average loss, maximum drawdown, and expectancy.
- Test the rules on new data or in a demo environment.
Win rate alone does not determine profitability. A strategy with frequent small wins can still lose money if occasional losses are much larger. Conversely, a strategy with a lower win rate may be viable if its average winning trade sufficiently exceeds its average losing trade.
Historical results do not guarantee future performance. The purpose of testing is to identify weaknesses, understand risk, and determine whether the approach merits further investigation.
Frequently Asked Questions About The %R Trend Rev Indicator
What Is The %R Trend Rev Indicator Used For?
It is a TradingView indicator intended to help traders examine potential trend reversals. Its precise signals and calculations depend on the specific script, so traders should consult the author's documentation.
Is The %R Trend Rev Indicator Good For Forex Trading?
It may be useful as one component of a broader technical analysis strategy. Its effectiveness depends on the script's methodology, market conditions, timeframe, entry rules, risk management, and testing results.
Does The %R Trend Rev Indicator Predict Forex Reversals?
No indicator can reliably predict every reversal. A signal may precede a reversal, a temporary pullback, or continued movement in the existing direction. Price confirmation and risk controls remain important.
Can Beginners Use The %R Trend Rev Indicator?
Beginners can learn to interpret the indicator, but should first understand basic chart structure, support and resistance, momentum, stop-loss placement, and position sizing. Practicing on historical charts and a demo account can help build familiarity.
Can I Use The %R Trend Rev Indicator With Other TradingView Indicators?
Potentially, yes. Traders may compare its signals with trend, momentum, and price-action tools. However, each additional indicator should have a defined purpose, and the combined rules should be tested rather than assumed to be more accurate.
Which Currency Pairs Work Best With The Indicator?
There is no universally best currency pair without testing. Begin with liquid pairs such as EUR/USD or USD/JPY, then compare performance across different market conditions and trading sessions.
Is The Indicator Guaranteed To Make Profitable Trades?
No. All trading indicators can generate unsuccessful signals. Forex trading involves substantial risk, and losses can exceed expectations during periods of rapid price movement or poor execution.
Take The Next Step Toward Smarter Forex Trading
The %R Trend Rev Indicator can serve as a starting point for studying potential changes in market direction. Its real value depends on how well you understand its signals, combine them with price action, and incorporate them into a disciplined trading plan.
Do not chase every reversal. Learn to recognize the market conditions that matter, define your risk before entering, and test your strategy before committing capital.
At Forex Trading Unlocked, we help traders develop their understanding of currency markets, technical indicators, Japanese candlestick patterns, and practical trading strategies.
Continue building your Forex trading knowledge:
- Start Here: Explore our Forex Trading Guide to strengthen your understanding of the currency market.
- Master Price Action: Visit our High Probable Japanese Candlestick Patterns Guide to learn how candlestick formations can support your chart analysis.
- Explore TradingView: Visit TradingView to analyze Forex charts and investigate technical indicators.
- Improve Your Trading Process: Develop a consistent approach to trade selection, risk management, and performance evaluation.
Your next trading opportunity should begin with a plan—not a guess.
Explore Forex Trading Unlocked today and take the next step toward a more informed, disciplined approach to Forex trading.
Risk Disclaimer: Forex trading involves significant risk and may not be suitable for every investor. Technical indicators are analytical tools, not guarantees of future performance. Always conduct your own research, test strategies appropriately, and never risk money you cannot afford to lose.
👉 “Get Instant Access (Check Your Email)”
💥 IMPORTANT: One Last Step Required
After you enter your email, check your inbox (or spam folder) for a confirmation email.
👉 Click the confirmation link so I can send you your free Forex training.
⚠️ If you don’t confirm, I can’t send you anything.
👉 “⚠️ Access expires if not confirmed within 24 hours minutes.”
👉 “Takes 10 seconds. Instant access after email confirmation.”