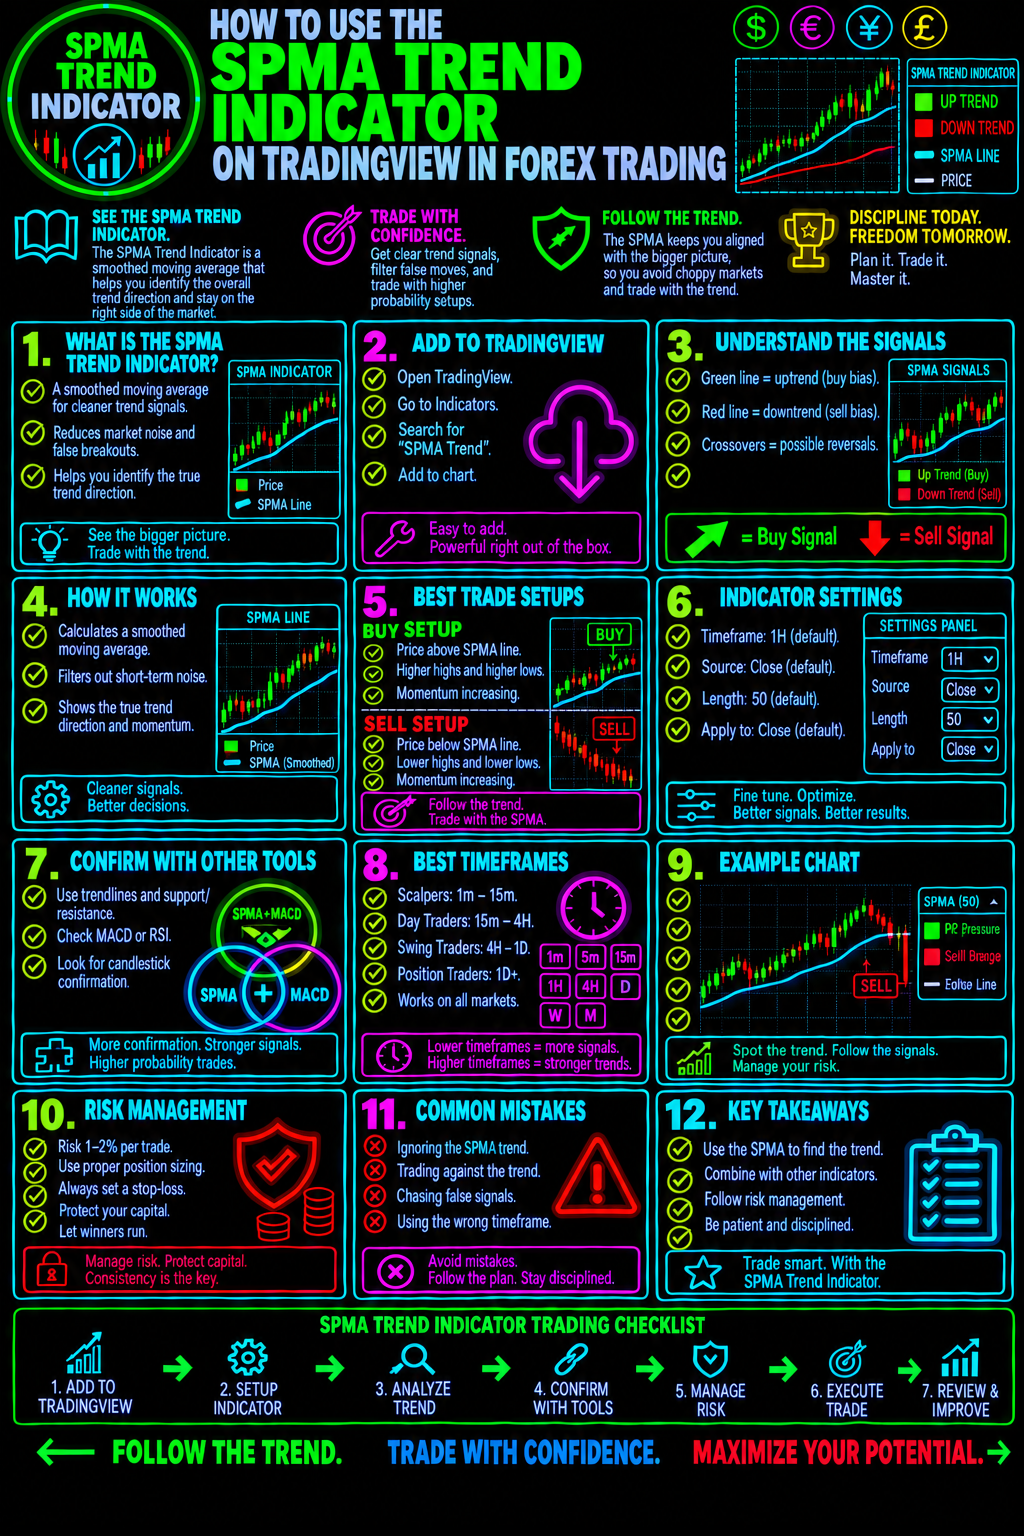
How to Use the SPMA Trend Indicator on TradingView in Forex Trading
Discover Forex Trends, Identify Trading Opportunities, and Make More Informed Trading Decisions
Are you tired of entering forex trades just as the market reverses? Do you struggle to determine whether a currency pair is trending higher, trending lower, or moving sideways?
Successful forex trading starts with understanding market direction. The SPMA Trend Indicator on TradingView is a tool traders can explore to help analyze price trends, recognize potential shifts in market direction, and develop a more structured approach to finding trading opportunities.
At Forex Trading Unlocked, we believe that better trading decisions begin with a clear strategy, disciplined risk management, and the ability to interpret what the market is telling you.
In this guide, you will learn how to use the SPMA Trend Indicator in forex trading, how to combine it with price action and other technical analysis tools, and how to incorporate its signals into a complete trading plan.
Want to become a more confident forex trader? Keep reading and discover how to make trend analysis a more effective part of your trading strategy.
What Is the SPMA Trend Indicator?
The SPMA Trend Indicator is a TradingView charting tool intended for traders interested in analyzing market trends and price direction.
When evaluating any trend indicator, your objective should be to determine whether its visual signals can help you recognize developing trends, confirm existing market direction, or identify conditions that deserve closer examination.
Before trading with SPMA, review its TradingView description, settings, and signal methodology. The precise calculations and signal behavior depend on the specific indicator implementation, so do not assume that every SPMA version uses identical rules.
Forex traders can evaluate the indicator alongside:
- Price action and candlestick formations.
- Market structure, including higher highs and higher lows.
- Support and resistance zones.
- Moving averages and other trend-following tools.
- Momentum indicators that help evaluate the strength of a potential move.
- Stop-loss placement and position-sizing rules.
The goal is not to find a magical indicator that predicts every market move. The goal is to build a repeatable trading process that helps you evaluate opportunities while controlling risk.
Why Trend Analysis Matters in Forex Trading
The forex market constantly shifts between trending, ranging, and volatile conditions. A strategy that works during a strong trend may perform poorly when the market becomes choppy.
Trend analysis helps you organize your trading decisions around the prevailing market environment.
For example, when EUR/USD is establishing higher swing highs and higher swing lows, bullish market structure may support looking for long opportunities. When the pair is establishing lower highs and lower lows, bearish market structure may favor evaluating short opportunities.
A trend indicator can provide an additional perspective, but price behavior must still confirm whether a setup makes sense.
Three important questions should guide your analysis:
- What is the prevailing market direction? Determine whether price action supports a bullish, bearish, or sideways interpretation.
- Is there a tradable setup? Look for a logical entry supported by market structure, price action, and your strategy rules.
- Where is the trade invalidated? Identify the price level at which your trading thesis would no longer be valid before entering the position.
These questions help transform indicator observations into a disciplined trading process.
How to Add the SPMA Trend Indicator to TradingView
TradingView provides charting tools that allow traders to examine currency pairs, study price movements, and test technical analysis approaches.
Follow these steps to locate and evaluate the SPMA Trend Indicator.
Step 1: Open TradingView
Visit TradingView and open a chart.
Choose a forex currency pair you understand, such as EURUSD, GBPUSD, or USDJPY.
Step 2: Open the Indicators Menu
Select the Indicators option on the chart and search for “SPMA Trend Indicator.”
Review the available results carefully. Confirm that the indicator's name, publisher, description, and intended functionality match the version you want to use.
If the exact indicator is not available under that name, verify its official listing rather than substituting a different tool and assuming it works identically.
Step 3: Add the Indicator to Your Chart
Select the appropriate indicator to add it to your TradingView chart.
Examine its display, default settings, and any available documentation. Identify what its lines, colors, labels, or other visual elements represent before interpreting them as trading signals.
Step 4: Choose a Suitable Timeframe
The timeframe you select should match your trading style.
- Scalping: Shorter timeframes provide more frequent price updates but can produce substantial market noise.
- Day trading: Intraday charts can help evaluate opportunities within a trading session.
- Swing trading: Four-hour and daily charts can help reveal broader trends and significant price structures.
- Position trading: Daily and weekly charts can help evaluate longer-term market direction.
These are starting points, not universal rules. Test the indicator on the timeframes you intend to trade.
Step 5: Observe Before Trading
Study how the indicator behaves during historical trends, consolidations, and reversals.
Ask whether its signals tend to appear early, late, or during periods of sideways price action. Check whether its displayed information changes after a candle closes.
Do not risk real capital until you understand the tool's behavior and have tested your trading rules.
How to Use the SPMA Trend Indicator to Analyze Forex Trends
The most useful way to evaluate a trend indicator is to connect its signals with observable price behavior.
Because SPMA implementations may differ, the following process describes how to evaluate trend conditions rather than claiming that the indicator generates specific buy or sell signals.
1. Identify the Overall Trend
Begin by examining the broader market structure.
A bullish environment may feature higher highs, higher lows, and sustained buying pressure. A bearish environment may feature lower highs, lower lows, and sustained selling pressure.
Compare the indicator's displayed trend information with these price patterns.
If both point toward the same general direction, you have a stronger basis for investigating a trade than you would from an isolated indicator reading.
However, agreement between indicators does not guarantee that a trade will succeed.
2. Look for Pullbacks Within an Established Trend
A pullback occurs when price temporarily moves against the prevailing direction.
During an uptrend, price may retreat toward a previous support zone before attempting to move higher again. During a downtrend, price may rally toward resistance before sellers regain control.
Rather than chasing an extended move, watch how price behaves around these areas.
A potential setup becomes more interesting when the broader trend remains intact, price reaches a meaningful technical level, and a recognizable price-action pattern supports your entry rules.
Explore our guide to High-Probability Japanese Candlestick Patterns to learn how candlestick formations can add context to trend analysis.
3. Evaluate Potential Trend Changes
Trend reversals can offer opportunities, but they are also a common source of trading losses.
A change in an indicator's appearance should not automatically be treated as proof that a reversal has occurred.
Look for additional evidence, such as:
- A break of an important swing high or swing low.
- A change in the sequence of higher highs or lower lows.
- A decisive candlestick close beyond a relevant technical level.
- Follow-through in the anticipated direction.
- Confirmation from a broader timeframe when appropriate.
The objective is to distinguish a potentially meaningful market change from an ordinary pullback or temporary price fluctuation.
4. Avoid Trading Every Signal
More trades do not necessarily mean better results.
If the market is moving sideways, trend-following tools can produce conflicting readings or signals that quickly fail. During major economic announcements, sudden volatility can also make entries and stop-loss execution more difficult.
When the market conditions do not fit your strategy, waiting is a valid trading decision.
Professional trading is not about participating in every market movement. It is about selecting opportunities that meet predefined criteria.
How to Combine the SPMA Trend Indicator With Price Action
Indicator-based analysis becomes more useful when it is part of a broader trading method.
Consider a hypothetical EURUSD setup.
The four-hour chart shows a bullish market structure. Price subsequently pulls back toward an established support zone. On the one-hour chart, price forms a bullish candlestick pattern, while the SPMA Trend Indicator displays information consistent with the broader upward direction.
Instead of buying immediately, you evaluate the potential entry, determine where the setup would be invalidated, and calculate whether the potential reward justifies the risk.
Only if the setup satisfies your rules would you consider taking the trade.
This approach combines several distinct forms of analysis:
Trend direction: Helps establish the market bias.
Support and resistance: Helps identify areas where price may react.
Candlestick analysis: Helps evaluate the behavior of buyers and sellers.
Risk management: Defines how much capital is exposed if the trade fails.
No individual component guarantees a profitable outcome. The value comes from using consistent rules and testing the complete setup.
For additional technical analysis education, visit our Forex Trading resources and explore ways to integrate trend analysis into a repeatable trading plan.
SPMA Trend Indicator Trading Strategy: A Step-by-Step Framework
Use the following framework to evaluate potential trades systematically.
Step 1: Establish Your Market Bias
Review the higher timeframe and determine whether the market structure is bullish, bearish, or ranging.
Use the SPMA Trend Indicator as an additional analytical reference, not as an unquestioned instruction to buy or sell.
Step 2: Identify a Key Price Level
Mark relevant support, resistance, swing highs, swing lows, or breakout areas.
A signal near an important technical level may deserve closer examination than the same signal appearing in the middle of an unstructured price range.
Step 3: Wait for Your Entry Conditions
Define the conditions that must be present before you enter.
These might include alignment with the prevailing trend, a pullback to a technical level, a confirmed candlestick pattern, or a candle close that meets your rules.
Avoid changing your criteria simply because you are eager to enter a trade.
Step 4: Define Your Stop-Loss
Determine the price level that invalidates your trading idea.
Your stop-loss should reflect the market structure and your strategy rather than an arbitrary distance selected after entering the trade.
Also consider spread, slippage, and the possibility that a stop order may execute at a different price during fast markets.
Step 5: Calculate Your Position Size
Decide how much money you are prepared to lose if the stop-loss is reached.
For example, a trader with a $5,000 account who chooses to risk 1% on a trade would risk $50 before accounting for additional execution costs.
Position size should then be calculated from the stop distance and the value of the relevant currency pair's price movement.
Learn more through our forex education resources on risk management and trading discipline.
Step 6: Define Your Profit Target
Identify a logical target using market structure, nearby support or resistance, or your tested exit rules.
Evaluate the potential reward relative to the amount at risk. A favorable reward-to-risk ratio does not guarantee profitability, but it helps you assess whether a trade fits your plan.
Step 7: Record and Review the Result
Document the setup, entry, stop-loss, target, indicator conditions, and outcome.
After collecting enough trades, review whether the strategy performs differently in trending markets, ranging markets, and periods of high volatility.
A trading journal helps you replace assumptions with evidence.
Common Mistakes to Avoid When Using the SPMA Trend Indicator
Even a useful technical analysis tool can be misapplied.
Avoid these common mistakes when evaluating the SPMA Trend Indicator in forex trading.
1. Treating every signal as a guaranteed trade
No indicator can eliminate uncertainty. Wait for your complete setup rather than trading every change in the display.
2. Ignoring the broader market structure
A signal on a short timeframe may conflict with a strong move on a higher timeframe. Understand the context before making a decision.
3. Entering after an extended move
Late entries can leave little room before the next support or resistance level. Evaluate the remaining potential reward instead of chasing price.
4. Using too many indicators
Adding more tools can create conflicting signals rather than improving clarity. Start with a small number of complementary tools and determine whether each contributes useful information.
5. Trading without a stop-loss plan
A promising chart setup does not justify unlimited risk. Define your maximum acceptable loss and position size before entering.
6. Ignoring economic news
Interest-rate decisions, inflation releases, employment reports, and central-bank announcements can cause abrupt currency movements. Understand the event risk surrounding your planned trade.
7. Failing to test the strategy
A few successful trades are not evidence of a reliable method. Backtest your rules, account for trading costs, and forward-test under appropriate conditions before committing meaningful capital.
How to Test the SPMA Trend Indicator on TradingView
Before relying on the indicator, test the complete strategy rather than judging the tool by a handful of attractive chart examples.
Start by defining precise rules for market selection, timeframe, entry, stop-loss, profit target, and trade management.
Then examine historical data across different market environments.
Your review should consider:
- Win rate.
- Average winning trade compared with average losing trade.
- Maximum drawdown.
- Profit factor after estimated trading costs.
- Performance during trending and ranging conditions.
- The number of trades in the sample.
- Whether results remain reasonably consistent across different periods.
Be careful not to optimize the strategy so aggressively that it only fits historical data. A strategy that looks excellent on one currency pair or one specific period may perform poorly under different conditions.
TradingView's charting tools can help you inspect historical price action. If you use a backtesting script or strategy, verify that its rules accurately represent the method you intend to trade.
Is the SPMA Trend Indicator Suitable for Beginners?
The SPMA Trend Indicator may be worth evaluating if you are learning to analyze market direction and want another perspective on price behavior.
However, beginners should first understand the fundamentals of forex trading, including currency pairs, pips, spreads, leverage, order execution, and position sizing.
An indicator cannot replace that knowledge.
Start with a demo account, use a small set of clearly defined rules, and concentrate on following your trading plan consistently. Do not assume that an indicator is profitable simply because its signals appear clear on a historical chart.
If you are building your foundation, start with our Forex Trading education resources and continue developing your understanding of price action, technical analysis, and risk management.
Take Your Forex Trading Education Further With Forex Trading Unlocked
Learning an indicator is only one part of becoming a more disciplined forex trader.
The next step is to connect trend analysis with a complete trading process that includes market structure, entry confirmation, trade management, and risk control.
At Forex Trading Unlocked, our mission is to help traders develop the knowledge and practical skills needed to make more informed decisions in the currency markets.
Explore these resources to continue your education:
Master High-Probability Japanese Candlestick Patterns
Learn how candlestick formations can help you evaluate potential reversals, continuation patterns, and price reactions around important market levels.
Start here: High-Probable Japanese Candlestick Patterns Improve Your Overall Forex Trading Knowledge
Build a stronger foundation in technical analysis, trading strategies, and the mechanics of the foreign exchange market.
Explore our resources: Forex Trading Unlocked
Explore TradingView Charting Tools
Study different charting tools and technical indicators to determine which ones genuinely support your trading methodology.
Visit: TradingView
Learn to Put Risk Management First
Develop a consistent approach to position sizing, stop-loss placement, and capital preservation. Protecting your trading capital is essential because even well-researched setups can fail.
Frequently Asked Questions About the SPMA Trend Indicator
What does the SPMA Trend Indicator do?
The SPMA Trend Indicator is a TradingView tool that traders can evaluate for trend analysis. Its exact calculations and displayed signals depend on the specific version. Review its official description and settings before using it in a trading strategy.
Can I use the SPMA Trend Indicator for forex trading?
You can evaluate the indicator on forex charts if the version you select supports your intended chart and market data. Test its behavior on your preferred currency pairs and timeframes before using it to guide live trades.
Does the SPMA Trend Indicator generate buy and sell signals?
That depends on the specific implementation. Confirm whether your version displays explicit entry signals or simply provides trend-related information. Do not assume that a trend indication is a complete trade recommendation.
Which timeframe is best for the SPMA Trend Indicator?
There is no universally best timeframe. Scalpers, day traders, and swing traders have different needs. Test the indicator on the timeframe that matches your strategy and compare its behavior across market conditions.
Can the SPMA Trend Indicator predict forex market reversals?
No indicator can reliably predict every reversal. Trend-related information may help you investigate changes in market direction, but price action, market structure, and risk management remain essential.
Should I combine the SPMA Trend Indicator with other indicators?
You can evaluate it alongside complementary tools such as support and resistance, candlestick analysis, or a momentum indicator. The objective is to improve your decision-making process, not to accumulate indicators without a clear purpose.
Is the SPMA Trend Indicator profitable?
Profitability depends on the specific implementation, trading rules, market conditions, execution costs, and risk management. The indicator alone does not guarantee profitable results. Test the complete strategy before risking real money.
Final Thoughts: Build a More Disciplined Forex Trading Strategy
The SPMA Trend Indicator on TradingView is a tool worth examining if you want to strengthen the way you analyze market direction.
The key is to understand what the indicator actually measures, evaluate its behavior in different market conditions, and combine its information with price action, market structure, and disciplined risk management.
Do not trade simply because an indicator changes. Identify the market environment, wait for a setup that meets your rules, calculate your risk, and evaluate your results over a meaningful sample of trades.
Ready to take the next step in your forex trading education?
Explore Forex Trading Unlocked, strengthen your technical analysis skills, and discover how a structured approach can help you make more informed trading decisions.
Disclaimer: This content is for educational and informational purposes only and does not constitute financial or investment advice. Forex trading involves substantial risk, including the potential loss of your invested capital. Past performance does not guarantee future results.
👉 “Get Instant Access (Check Your Email)”
💥 IMPORTANT: One Last Step Required
After you enter your email, check your inbox (or spam folder) for a confirmation email.
👉 Click the confirmation link so I can send you your free Forex training.
⚠️ If you don’t confirm, I can’t send you anything.
👉 “⚠️ Access expires if not confirmed within 24 hours minutes.”
👉 “Takes 10 seconds. Instant access after email confirmation.”