How To Use The Smart Flow Imbalance Indicator On TradingView In Forex Trading
The Forex market is constantly searching for balance.
When buying and selling pressure becomes uneven, that balance can be disrupted—and those disruptions can create some of the most interesting trading opportunities in the market.
The Smart Flow Imbalance Indicator on TradingView is designed to help Forex traders identify these potential market imbalances and better understand where buying and selling pressure may be shifting.
But an indicator alone does not make a trader profitable.
The real advantage comes from understanding what the indicator is showing, why the imbalance matters, and how to combine that information with price action, trend analysis, support and resistance, and disciplined risk management.
That is exactly what you will learn on this page.
Whether you are a new Forex trader learning how market flow works or an experienced trader looking for another confirmation tool, the Smart Flow Imbalance Indicator can become a valuable addition to your TradingView analysis.
What Is The Smart Flow Imbalance Indicator?
The Smart Flow Imbalance Indicator is a TradingView analysis tool designed to help traders identify areas where market flow may be becoming imbalanced between buyers and sellers.
In simple terms, the indicator attempts to help you recognize situations where buying pressure or selling pressure becomes unusually strong relative to the opposing side of the market.
These imbalances can be important because markets do not move randomly from one price level to another.
Price moves because the balance between buyers and sellers changes.
When buying pressure overwhelms selling pressure, price can move higher.
When selling pressure overwhelms buying pressure, price can move lower.
The Smart Flow Imbalance Indicator can therefore be used as another layer of information when analyzing potential market direction, momentum, reversals, breakouts, and continuation setups.
However, traders should avoid treating an imbalance signal as an automatic buy or sell command.
Instead, think of the indicator as a market-analysis tool that can help you ask better questions:
- Is buying pressure increasing?
- Is selling pressure increasing?
- Is the current trend supported by market flow?
- Could momentum be changing?
- Is price approaching an important support or resistance level?
- Is an apparent breakout supported by stronger market participation?
- Could the market be preparing for a reversal?
Those questions can lead to much stronger trading decisions than simply reacting to an indicator signal.
Why Market Imbalances Matter In Forex Trading
Forex is a constantly moving auction.
Every major currency pair is influenced by the interaction between buyers and sellers.
When those forces remain relatively balanced, price may consolidate or move sideways.
But when one side becomes dominant, price can begin to travel aggressively.
This is where understanding market imbalance becomes important.
Imagine EUR/USD trading within a relatively narrow range.
Buyers and sellers have been competing around the same prices.
Then buying pressure suddenly increases.
If that buying pressure is strong enough, price may begin pushing above the established range.
That movement can potentially develop into a breakout.
The opposite can happen when sellers overwhelm buyers.
Price may fall through support and begin establishing a new lower trading range.
The Smart Flow Imbalance Indicator can provide additional information about these changing conditions.
This becomes particularly useful when the indicator is combined with other forms of technical analysis.
How To Add The Smart Flow Imbalance Indicator To TradingView
TradingView makes it relatively simple to add indicators to a Forex chart.
Start by opening the currency pair you want to analyze.
For example:
- EURUSD
- GBPUSD
- USDJPY
- AUDUSD
- USDCAD
- USDCHF
- NZDUSD
Then open the Indicators section within TradingView.
Search for:
Smart Flow Imbalance
Select the appropriate indicator from the results and add it to your chart.
Once it appears, take some time to understand the indicator's visual components and settings before using it with real trading decisions.
This is an important step.
Do not immediately begin taking trades simply because the indicator has been added to your chart.
First learn how its signals behave across different market environments.
How To Read The Smart Flow Imbalance Indicator
The first objective is not to predict every market movement.
Your objective is to understand whether the indicator is showing evidence of changing market flow.
Look for periods where the indicator identifies an imbalance between buying and selling pressure.
Then compare that information with what price itself is doing.
This is critical.
Price should remain the primary source of information.
The indicator can provide confirmation, but the chart tells you what the market has actually done.
For example, if price is making higher highs and higher lows while the indicator shows stronger bullish flow, those two pieces of information may reinforce one another.
Conversely, if price is rising but the indicator begins showing weakening bullish flow, that difference deserves attention.
It does not automatically mean price will reverse.
But it may tell you that momentum deserves closer examination.
Smart Flow Imbalance And Forex Trends
One of the most useful applications of an imbalance indicator is trend analysis.
Before considering a trade, determine whether the market is trending higher, trending lower, or moving sideways.Bullish Market
In a bullish market, you generally want to see:
- Higher highs
- Higher lows
- Price holding above important support
- Positive momentum
- Buying pressure supporting the trend
If the Smart Flow Imbalance Indicator also indicates stronger bullish market flow, that can provide additional confirmation.Bearish Market
In a bearish market, look for:
- Lower highs
- Lower lows
- Price remaining below important resistance
- Negative momentum
- Selling pressure supporting the trend
A bearish imbalance reading occurring alongside a clear downtrend may provide additional confirmation of the market environment.Sideways Market
Consolidating markets require more caution.
Price may repeatedly move between support and resistance while buying and selling pressure constantly shifts.
This can produce signals that look attractive but fail quickly.
That is why understanding the broader market structure is so important.
Using The Smart Flow Imbalance Indicator With Support And Resistance
One of the strongest ways to improve an indicator-based trading approach is to combine it with support and resistance analysis.
Support represents an area where buying interest has historically appeared.
Resistance represents an area where selling interest has historically appeared.
Now consider what happens when an imbalance appears near one of these important levels.
Bullish Example
Price approaches established support.
Selling pressure begins weakening.
The Smart Flow Imbalance Indicator begins showing stronger bullish flow.
Price then starts moving higher.
Instead of relying on the indicator alone, you now have multiple pieces of information pointing in the same direction.
Bearish Example
Price approaches resistance.
Buying momentum begins weakening.
Selling pressure begins increasing.
The Smart Flow Imbalance Indicator confirms stronger bearish flow.
Price then begins rejecting the resistance area.
Again, the indicator is not making the decision by itself.
It is helping provide additional context.
For traders who want to strengthen their understanding of support and resistance, explore the Forex Support and Resistance resources throughout Forex Trading Unlocked.
Using Smart Flow Imbalance With Trendlines
Trendlines can provide another layer of market structure.
An ascending trendline can help identify an area where buyers have repeatedly defended price.
A descending trendline can identify an area where sellers have repeatedly pressured price.
When price approaches a trendline, watch how market flow behaves.
For example, if EUR/USD is maintaining an established bullish trend and approaches ascending trendline support, increasing bullish imbalance may provide useful confirmation.
On the other hand, if price breaks through trendline support while bearish imbalance increases, that could indicate a potentially important change in market conditions.
The key is to watch the relationship between price and market flow.
Smart Flow Imbalance And Breakout Trading
Breakouts are among the most popular Forex trading opportunities.
They can also produce some of the most frustrating false signals.
Price may break above resistance only to immediately fall back into the previous range.
Or price may break below support and then reverse sharply.
This is why traders should not automatically chase every breakout.
Instead, look for confirmation.
A bullish breakout becomes more interesting when:
- Price breaks established resistance
- Market structure supports the move
- Momentum increases
- Buying pressure strengthens
- The imbalance indicator supports bullish flow
A bearish breakout becomes more interesting when:
- Price breaks established support
- Market structure supports the move
- Momentum shifts lower
- Selling pressure strengthens
- The imbalance indicator supports bearish flow
The goal is not to predict every breakout.
The goal is to identify higher-quality trading environments.
Smart Flow Imbalance And Market Reversals
Imbalance information can also be useful when looking for potential trend reversals.
However, reversal trading requires caution.
A market can remain overextended longer than expected.
Therefore, an imbalance reading should not automatically be interpreted as a reversal signal.
Instead, watch for multiple confirmations.
For example:
- Price reaches an important support or resistance zone.
- Price begins showing rejection.
- Market structure starts changing.
- Momentum begins weakening.
- Smart Flow Imbalance shifts in the opposite direction.
- Price confirms the developing reversal.
The more pieces of evidence that align, the stronger the overall trading thesis can become.
Smart Flow Imbalance With Japanese Candlestick Patterns
Japanese candlesticks provide another powerful confirmation layer.
Candlestick patterns can help traders understand the battle between buyers and sellers during a specific period.
Patterns such as:
- Doji
- Hammer
- Shooting Star
- Engulfing patterns
- Morning Star
- Evening Star
- Pin Bars
can provide useful information when they appear at important market levels.
Imagine price reaches major resistance and forms a bearish rejection candle while the Smart Flow Imbalance Indicator begins showing increasing selling pressure.
That combination can be considerably more informative than either signal viewed independently.
This is why Forex Trading Unlocked places such a strong emphasis on High Probability Japanese Candlestick Patterns.
If you want to strengthen your candlestick analysis, explore the High Probability Japanese Candlestick Patterns resources available throughout the site.
Smart Flow Imbalance And Multi-Timeframe Analysis
One of the biggest mistakes Forex traders make is analyzing only one timeframe.
A signal on a five-minute chart may look bullish while the four-hour chart is showing a powerful bearish trend.
That conflict matters.
A better approach is to use multiple timeframes.
For example:Higher Timeframe
Use the daily or four-hour chart to identify:
- Major trend
- Market structure
- Major support
- Major resistance
- Overall direction
Intermediate Timeframe
Use the one-hour chart to examine:
- Developing momentum
- Pullbacks
- Breakouts
- Trend continuation
Lower Timeframe
Use the 15-minute or five-minute chart to refine:
- Entry timing
- Candlestick confirmation
- Short-term market flow
- Stop-loss placement
The Smart Flow Imbalance Indicator can then become part of a larger multi-timeframe trading process.
A Smart Flow Imbalance Trading Strategy
Let's put the concepts together.
A simple framework can be built around Trend + Level + Imbalance + Confirmation + Risk Management.Step 1: Identify The Trend
Start with the higher timeframe.
Is the market:
- Bullish?
- Bearish?
- Sideways?
Do not rush this step.
The market environment determines which setups deserve attention.
Step 2: Identify Important Levels
Mark major:
- Support
- Resistance
- Swing highs
- Swing lows
- Breakout levels
- Trendlines
These levels provide context for the indicator.
Step 3: Watch The Imbalance
Now monitor the Smart Flow Imbalance Indicator.
Look for evidence that market flow is supporting the direction you are considering.
Step 4: Wait For Price Confirmation
Do not enter simply because the indicator changes.
Wait for price to confirm your idea.
This could involve:
- A breakout
- A rejection
- A higher low
- A lower high
- A candlestick pattern
- A market-structure shift
Step 5: Define Your Risk
Before entering the trade, know:
- Entry price
- Stop-loss
- Profit target
- Maximum amount you are willing to risk
A trading setup is incomplete without risk management.
Smart Flow Imbalance Entry Example
Suppose GBP/USD is trending higher on the four-hour chart.
Price pulls back toward a previous support area.
On the one-hour chart, price begins stabilizing.
The Smart Flow Imbalance Indicator begins showing stronger bullish flow.
A bullish candlestick pattern then develops around support.
Instead of buying simply because the indicator is bullish, the trader now has several confirmations:
Bullish trend + support + improving flow + bullish price action.
The trader can then define an entry, stop-loss, and target according to their trading plan.
This is the difference between using an indicator and building a trading strategy around an indicator.
Smart Flow Imbalance Sell Setup
Now consider the opposite scenario.
EUR/USD is trending lower.
Price rallies into a major resistance zone.
The market begins rejecting that level.
The Smart Flow Imbalance Indicator begins showing stronger selling pressure.
A bearish candlestick pattern develops.
The trader now has:
Bearish trend + resistance + bearish flow + bearish price action.
Again, the indicator is not being used in isolation.
It is part of a confirmation process.
Common Mistakes When Using The Smart Flow Imbalance Indicator
Even a useful indicator can become dangerous when used incorrectly.
Mistake #1: Treating Every Signal As A Trade
Not every imbalance deserves an entry.
Market context matters.
Mistake #2: Ignoring The Trend
Trading against a powerful trend simply because an indicator changes direction can lead to unnecessary losses.
Mistake #3: Entering Too Early
An indicator may suggest that conditions are changing before price actually confirms the move.
Patience matters.
Mistake #4: Ignoring Support And Resistance
A bullish signal directly beneath major resistance may have limited upside.
A bearish signal directly above major support may have limited downside.
Mistake #5: Risking Too Much
No indicator can eliminate trading risk.
Proper position sizing and stop-loss discipline remain essential.
How To Combine Smart Flow Imbalance With Other Trading Indicators
The Smart Flow Imbalance Indicator does not have to work alone.
Depending on your strategy, you can combine it with other TradingView tools.
Potential confirmation tools include:
Moving Averages
Moving averages can help identify broader trend direction.
RSI
The Relative Strength Index can help evaluate momentum and potentially identify overbought or oversold conditions.
MACD
MACD can provide information about momentum, trend direction, and potential momentum shifts.
Fibonacci
Fibonacci levels can help identify potential retracement and extension zones.
Volume-Based Tools
Volume-related analysis can provide additional context about market participation.
The important principle is simple:
Do not add indicators simply because you can.
Every indicator should have a specific job.
If five indicators are all telling you essentially the same thing, you may not be adding five times the information.
You may simply be adding complexity.
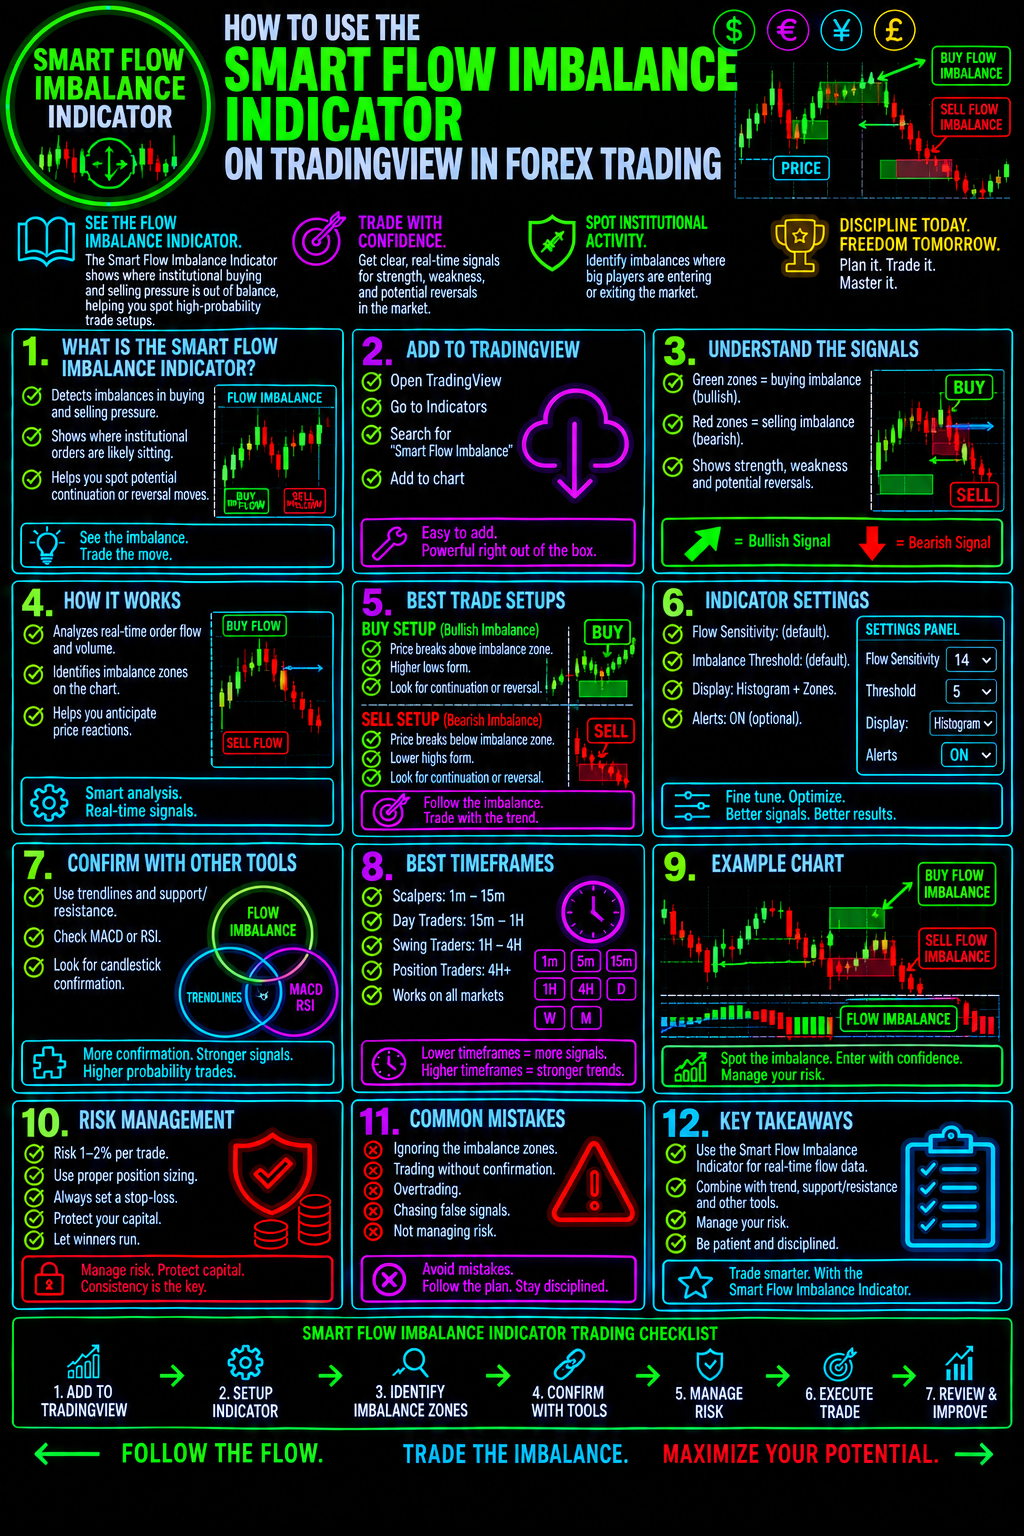
Smart Flow Imbalance Indicator TradingView Strategy: Keep It Simple
A powerful Forex trading system does not have to contain dozens of indicators.
In fact, excessive indicators can create confusion.
A cleaner system could look like this:
Trend → Support/Resistance → Smart Flow Imbalance → Price Action → Risk Management
That process gives every component a purpose.
The trend establishes direction.
Support and resistance establish location.
The Smart Flow Imbalance Indicator provides market-flow information.
Price action provides confirmation.
Risk management protects the trading account.
That is a much more disciplined approach than randomly entering trades whenever an indicator changes color or produces a signal.
Risk Management Is More Important Than The Indicator
This deserves special attention.
A trader can have an excellent entry strategy and still lose money through poor risk management.
No indicator can guarantee:
- Winning trades
- Accurate predictions
- Profitable signals
- Successful breakouts
- Perfect reversals
Forex trading involves substantial risk.
Your first objective should always be controlling the amount you can lose.
Many traders use a predetermined percentage of account equity as their maximum risk per trade.
The exact amount should be determined according to your own trading plan, account size, experience, and risk tolerance.
If you want to build a stronger foundation in this area, explore the Forex Risk Management resources and guides available through Forex Trading Unlocked.
The Smart Flow Imbalance Indicator Is A Tool—Not A Crystal Ball
This may be the most important lesson on this entire page.
The Smart Flow Imbalance Indicator cannot tell you exactly what the Forex market will do next.
No indicator can.
What it can do is help organize information about market flow so you can make more informed decisions.
The best traders are not trying to find one magical indicator.
They are building repeatable processes.
They understand:
Market Structure + Trend + Levels + Momentum + Price Action + Risk Management
The Smart Flow Imbalance Indicator can become one component of that process.
Build Your Complete Forex Trading System
If you are serious about improving your Forex trading, do not stop with one TradingView indicator.
Build a complete trading education.
Start with the fundamentals.
Learn how currency markets work.
Then develop your understanding of:
- Forex market structure
- Support and resistance
- Japanese candlesticks
- Trendlines
- Chart patterns
- Technical indicators
- Risk management
- Trading psychology
- Entry and exit strategies
- Multi-timeframe analysis
Then bring those concepts together into a trading plan.
That is where real progress begins.
Take Your Forex Trading To The Next Level
The Smart Flow Imbalance Indicator can help you see market conditions from another perspective.
But the real objective is bigger than learning another indicator.
The objective is learning how to read the Forex market.
If you want to develop higher-probability trading skills, continue exploring Forex Trading Unlocked.
Discover our:
Forex Trading Strategies
Learn how different trading strategies are built and when they may be appropriate.
Japanese Candlestick Patterns
Learn how price action can reveal the battle between buyers and sellers.
Forex Risk Management
Build the discipline required to protect trading capital.
TradingView Forex Indicators
Explore additional TradingView indicators and learn how they can be incorporated into a broader trading system.
Forex Trading Courses
Go beyond individual indicators and develop a structured understanding of Forex trading.
Ready To Trade Smarter?
An indicator can show you information.
Knowledge teaches you what to do with it.
The Smart Flow Imbalance Indicator can become a valuable part of your TradingView Forex analysis—but only when it is combined with market structure, price action, confirmation, and disciplined risk management.
Do not chase every signal.
Do not assume every imbalance becomes a trend.
Do not risk more simply because an indicator looks convincing.
Instead, develop a repeatable process.
Find the trend.
Find the level.
Watch the flow.
Wait for confirmation.
Control your risk.
That is how you turn another TradingView indicator into a potentially useful component of a serious Forex trading system.
Continue Your Forex Trading Education
Want more high-probability Forex setups?
Explore the High Probability Forex Setups resources at Forex Trading Unlocked and learn how candlesticks, trend shifts, support and resistance, and market structure can work together.
Want to master Japanese candlesticks?
Explore the High Probability Japanese Candlestick Patterns guide and learn the patterns every serious Forex trader should know.
Want to improve your risk management?
Explore the Forex Risk Management Guide and build stronger habits around position sizing, stop-losses, and capital preservation.
Want to master TradingView?
Continue exploring the growing collection of TradingView Forex Indicator guides throughout Forex Trading Unlocked.
The more you understand the market, the less you have to rely on guesswork.
Forex Trading Unlocked is built to help you do exactly that.
👉 “Get Instant Access (Check Your Email)”
💥 IMPORTANT: One Last Step Required
After you enter your email, check your inbox (or spam folder) for a confirmation email.
👉 Click the confirmation link so I can send you your free Forex training.
⚠️ If you don’t confirm, I can’t send you anything.
👉 “⚠️ Access expires if not confirmed within 24 hours minutes.”
👉 “Takes 10 seconds. Instant access after email confirmation.”