How To Use The Sniper Entry/Exit with SL & TP Indicator On TradingView In Forex Trading
Forex traders are constantly searching for better ways to identify high-probability trade entries, precise exits, stop-loss levels, and take-profit targets.
The Sniper Entry/Exit with SL & TP Indicator on TradingView is designed to help traders organize these critical decisions directly on their Forex charts.
Instead of entering a trade simply because a candle looks bullish or bearish, traders can use an indicator-based framework to help identify potential entry and exit areas while keeping risk management, stop-loss placement, and profit targets in the trading plan.
But there is an important distinction:
An indicator is not a trading system by itself.
The real advantage comes from combining indicator signals with Forex market structure, trend direction, support and resistance, price action, candlestick patterns, and disciplined risk management.
That is where this guide comes in.
What Is The Sniper Entry/Exit With SL & TP Indicator?
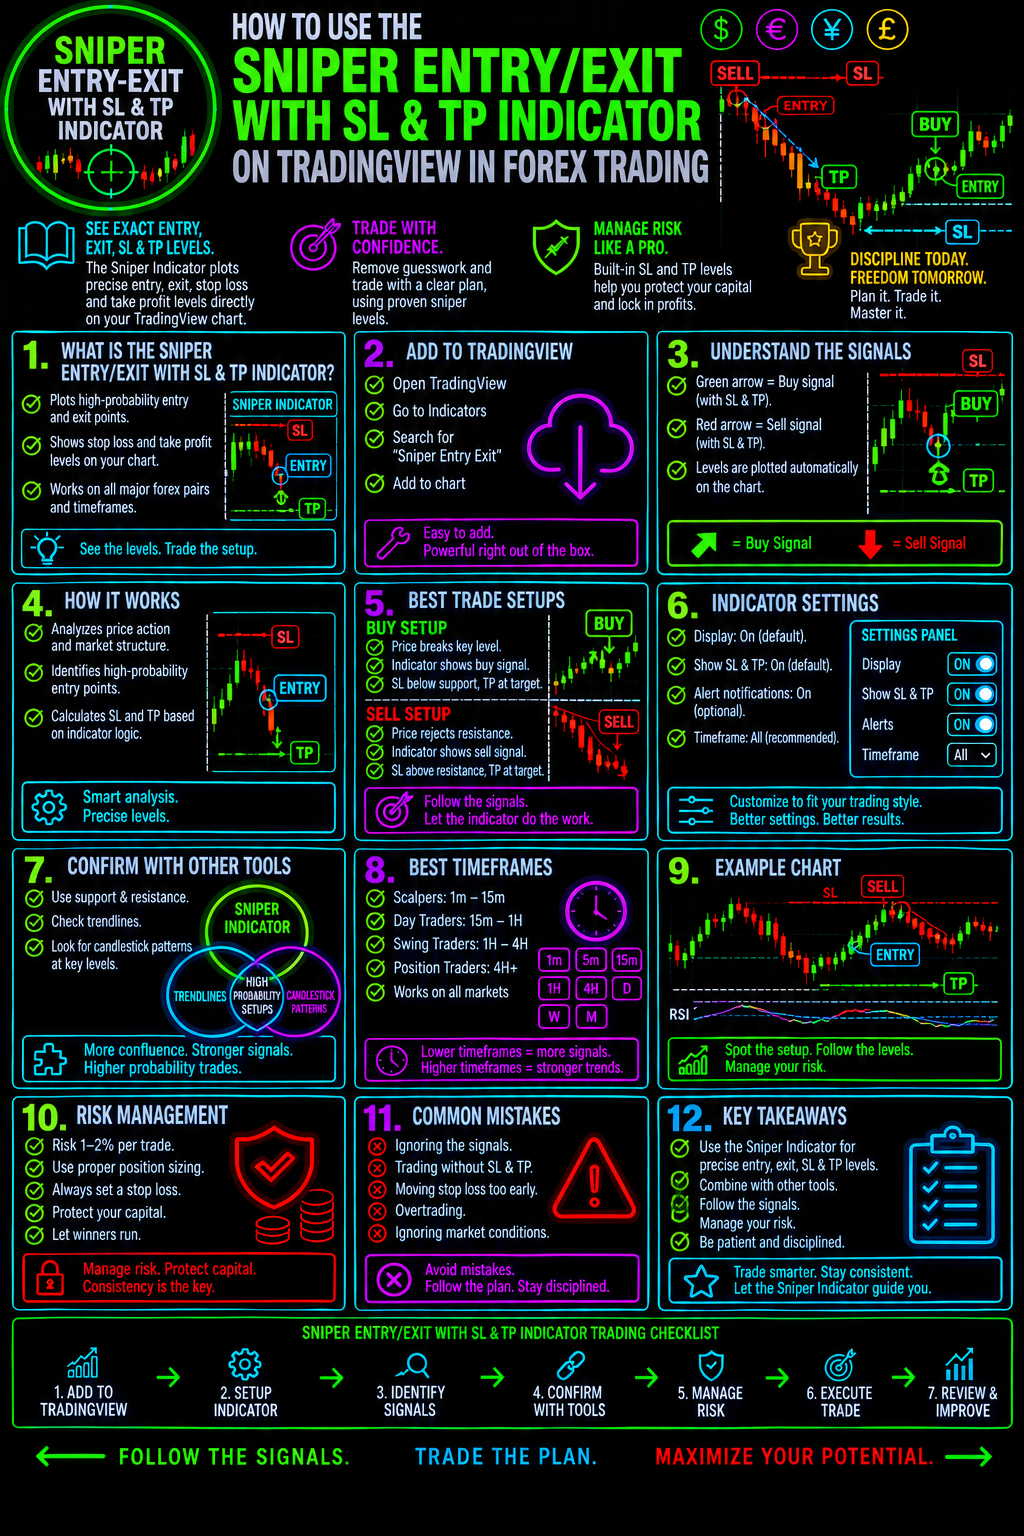
The Sniper Entry/Exit with SL & TP Indicator is a TradingView-based technical analysis tool designed to help Forex traders visualize potential entry signals, exit signals, stop-loss levels, and take-profit levels on a price chart.
The concept is straightforward:
Find a potential trade → define the risk → establish the target → manage the position according to the trading plan.
This can help eliminate one of the biggest problems facing Forex traders:Entering a trade without knowing where the trade should be invalidated.
A trader might correctly identify that EUR/USD is trending higher but still lose money by entering too late, placing a stop loss randomly, or failing to establish a logical profit target.
A structured indicator can help put those decisions directly onto the chart.
However, traders should always verify how the specific version of the indicator calculates and displays its signals before using it with real money.
Why Entry, Stop Loss & Take Profit Must Work Together
A Forex trade should never be viewed as simply:
BUY or SELL.
A complete trade idea contains several components.
1. Entry
Where are you considering entering the market?
2. Stop Loss
At what price is the original trade idea considered invalid?
3. Take Profit
Where will you consider taking profits if price moves in your anticipated direction?
4. Risk
How much of your trading account are you willing to lose if the trade fails?
These four components work together.
For example, a trader could receive a bullish signal on EURUSD.
Instead of immediately buying, the trader can ask:
- Is the broader trend bullish?
- Is price above or below important support?
- Is the signal occurring near a meaningful market structure level?
- Does the potential reward justify the amount being risked?
- Is there a nearby resistance level that could interfere with the trade?
- Does the candlestick structure confirm the setup?
This creates a much more disciplined process.
How To Add The Indicator To TradingView
TradingView makes it possible to place technical indicators directly onto a Forex chart.
To begin:
- Open your TradingView chart.
- Select the Forex pair you want to analyze.
- Choose Indicators.
- Search for Sniper Entry/Exit with SL & TP.
- Select the appropriate indicator.
- Add it to your chart.
- Review the available settings.
- Adjust the display and parameters according to your trading methodology.
Before trading live, spend time observing how the indicator behaves across different market conditions.
Do not assume that every signal will produce a winning trade.
The objective is to understand when the signals appear, where they appear, and what market conditions surround them.
How The Sniper Entry Signal Can Be Used
A potential entry signal is only the beginning of the analysis.
When a bullish signal appears, traders can examine the chart for confirmation.
Look for:
Trend + Market Structure + Price Action + Risk/Reward
For example, if EURUSD produces a bullish entry signal while price is also making higher highs and higher lows, the signal may deserve additional attention.
The opposite applies to a bearish signal.
If USD/JPY produces a bearish signal while the market is already establishing lower highs and lower lows, the trader can investigate whether the signal agrees with the broader trend.
This is known as confluence.
The more independent pieces of evidence that support the same trade idea, the more information the trader has available before entering.
Do Not Trade Every Signal
This is one of the most important principles when using any Forex indicator.
A chart can produce signals in:
- Strong trends
- Weak trends
- Ranging markets
- Choppy markets
- High-volatility conditions
- Low-volatility conditions
- News-driven markets
Those environments are not identical.
A signal that works well during a strong directional move may behave very differently when the market begins moving sideways.
That is why the Sniper Entry/Exit indicator should be treated as a decision-support tool, rather than an automatic buy-and-sell machine.The goal isn't more signals.The goal is better-qualified trades.
Using The Stop Loss Component
The SL portion of the indicator can help traders visualize a potential stop-loss area.
But traders should understand what a stop loss actually represents.
A stop loss is not simply a number displayed on a chart.
It represents the point at which the trader's original market thesis is no longer valid.
For a bullish setup, this could potentially be below an important swing low or structural support area.
For a bearish setup, the invalidation point could potentially be above a meaningful swing high or resistance area.
The exact placement depends on the trading strategy, volatility, timeframe, and market structure.
A stop that is too tight may be triggered by normal market fluctuations.
A stop that is excessively wide may expose the account to unnecessary risk.
Risk Management Comes First
One of the most important concepts in Forex trading is position sizing.
A trader should determine the acceptable account risk before determining the position size.
For example, a trader may establish a maximum risk of approximately 1% of account equity on a particular trade.
The position size can then be calculated based on:
Account Risk ÷ Stop-Loss Distance = Position Size
This approach is fundamentally different from choosing a position size first and then discovering how much money is actually being placed at risk.
Learn more about controlling downside exposure with our:
Forex Risk Management Guide
Use risk management to protect your trading capital while you develop and test your strategy.
Using The Take Profit Component
The TP portion of the indicator can help traders identify a potential profit target.
But a take-profit level should make sense within the market.
For example, if a bullish trade has a potential target directly below major resistance, the trader should consider whether there is enough room for the trade to develop.
Likewise, if a bearish trade is targeting an area of significant support, that support may affect the probability of price continuing lower.
This is why traders should combine indicator-generated levels with:
- Support and resistance
- Previous highs and lows
- Market structure
- Trendlines
- Fibonacci levels
- Candlestick patterns
- Volatility
- Higher-timeframe analysis
The indicator provides information.
The trader provides the decision-making framework.
Understanding Risk-to-Reward
Risk-to-reward is another critical component of an entry/SL/TP strategy.
Suppose a trader identifies:
Potential Risk: 20 pips
Potential Reward: 40 pips
That represents a potential 1:2 risk-to-reward relationship.
The trader is potentially risking 1 unit to pursue 2 units of reward.
This does not guarantee profitability.
A strategy still requires a sufficient win rate and consistent execution.
But thinking in terms of risk and reward forces the trader to consider the complete trade rather than focusing exclusively on whether the entry signal is correct.
Combining Sniper Signals With Forex Market Structure
One of the most powerful ways to improve indicator analysis is to incorporate market structure.
Ask:Is the market trending higher?
Look for a sequence of higher highs and higher lows.Is the market trending lower?
Look for lower highs and lower lows.Is the market ranging?
Identify the boundaries of the trading range.Is the market transitioning?
Watch for potential breaks of established structure and subsequent confirmation.
A bullish indicator signal occurring inside a strong bullish structure is different from a bullish signal appearing directly into major resistance.
Context matters.
Combine The Indicator With Support & Resistance
Support and resistance can provide another layer of confirmation.
Imagine that price approaches a previously established support zone and the Sniper Entry/Exit indicator produces a bullish signal.
The trader now has two pieces of information:
Market Location + Indicator Signal
That can be more useful than simply taking every bullish signal regardless of where price is located.
The same principle applies to resistance and bearish setups.
If you want to strengthen your understanding of these concepts, explore our:
Forex Support & Resistance Trading Guide
Understanding where buyers and sellers have previously reacted can dramatically improve the context surrounding indicator signals.
Combine Sniper Signals With Japanese Candlestick Patterns
Candlestick analysis can add another confirmation layer.
For example, a bullish indicator signal near support accompanied by a bullish reversal candlestick pattern may provide additional information about the market's price action.
Potential patterns to study include:
The important point is not to memorize patterns simply for the sake of memorization.
Instead, understand what the candle is communicating about the battle between buyers and sellers.
Explore our:
High Probability Japanese Candlestick Patterns Every Trader Should Know
This can help you build a stronger price-action foundation around your indicator analysis.
Using Multiple Timeframes
A Sniper Entry/Exit signal can look attractive on one timeframe while the larger market is moving in the opposite direction.
This is why multiple-timeframe analysis can be valuable.
For example:
Higher Timeframe
Determine the broader market direction.
Middle Timeframe
Identify the current structure and important price zones.
Lower Timeframe
Look for a potential entry trigger.
A trader might therefore analyze:
Daily → 4-Hour → 1-Hour
or:
4-Hour → 1-Hour → 15-Minute
The exact combination depends on the trader's strategy and holding period.
The objective is to understand the larger market environment before becoming overly focused on a single entry signal.
Sniper Indicator For Scalping
Short-term traders may use the indicator while analyzing lower timeframes.
However, scalping introduces additional challenges.
Lower timeframes can contain more:
- Market noise
- False breakouts
- Short-term reversals
- Spread considerations
- Volatility spikes
- Rapid signal changes
A scalper should therefore test the indicator extensively before relying on it in live trading.
If you are interested in short-term Forex strategies, continue exploring our:
Forex Scalping Strategy
Sniper Indicator For Swing Trading
The same concepts can be applied to longer-term Forex trading.
Swing traders may focus on larger market structures and seek trades that have the potential to develop over multiple sessions.
Instead of reacting to every small movement, the trader can concentrate on:
Trend → Pullback → Confirmation → Entry → Stop → Target
This can reduce the temptation to overtrade every minor market fluctuation.
Explore our:
Forex Swing Trading Strategy
to learn more about structuring trades around larger market movements.
Common Mistakes When Using The Sniper Entry/Exit Indicator
Mistake #1: Taking Every Signal
More signals do not automatically mean more profitable trades.
Filter the signals through your trading rules.
Mistake #2: Ignoring The Trend
A trader may see a bullish signal and immediately buy despite the larger trend being strongly bearish.
Always examine the broader market structure.
Mistake #3: Moving The Stop Loss
Moving a stop farther away simply because the market is moving against you can transform a planned loss into an uncontrolled loss.
Define your risk before entering.
Mistake #4: Ignoring Resistance Or Support
A bullish signal directly beneath major resistance may have limited room to develop.
Likewise, a bearish signal immediately above strong support may face significant buying pressure.
Mistake #5: Risking Too Much
No indicator can eliminate losing trades.
Risk management exists because losing trades are part of trading.
Protecting your trading capital allows you to remain in the game long enough to develop and execute your strategy.
Mistake #6: Believing The Indicator Predicts The Future
Technical indicators analyze market data.
They do not provide certainty about what price will do next.
Treat signals as probabilistic information, not guarantees.
A Simple Sniper Entry/Exit Trading Framework
Here is a structured framework you can test.
Step 1 — Identify The Trend
Determine the broader direction using your preferred timeframe.
Step 2 — Identify Market Structure
Mark important highs, lows, support, and resistance.
Step 3 — Wait For The Indicator
Look for a Sniper Entry/Exit signal that agrees with your market analysis.
Step 4 — Look For Confirmation
Use price action, candlesticks, momentum, or another independent confirmation method.
Step 5 — Define The Stop
Determine where the trade thesis becomes invalid.
Step 6 — Calculate Risk
Determine the appropriate position size based on your predetermined account-risk rules.
Step 7 — Establish The Target
Identify a logical take-profit area based on market structure and available price movement.
Step 8 — Execute The Plan
Once the trade is placed, follow the rules instead of allowing emotions to dictate the outcome.
Step 9 — Review The Trade
Record the setup, entry, stop, target, outcome, and what happened afterward.
This creates a feedback loop that can help improve your trading process over time.
Backtest Before You Risk Real Money
One of the most important steps is testing.
Before incorporating the Sniper Entry/Exit with SL & TP Indicator into a live Forex strategy, test it across historical market conditions.
Track:
- Number of trades
- Winning trades
- Losing trades
- Average win
- Average loss
- Maximum drawdown
- Risk-to-reward
- Market condition
- Trading timeframe
- Currency pair
- Entry type
- Exit type
Do not judge an indicator based on a handful of trades.
Build a meaningful sample size.
The objective is to discover whether the complete trading methodology has an edge after spreads, execution, losses, and changing market conditions are considered.
Build A Complete High-Probability Forex Trading Process
The Sniper Entry/Exit indicator can become one component of a larger Forex trading methodology.
But successful trading is rarely about finding one magical indicator.
It is about combining multiple disciplines:
Market Structure
Trend Analysis
Support & Resistance
Candlestick Price Action
Technical Indicators
Risk Management
Trade Management
Trading Psychology
That combination creates a much stronger foundation than relying on a single signal.
And this is exactly why Forex Trading Unlocked exists.
Take Your Forex Trading Education Further
If you want to move beyond individual indicators and start building a more complete trading framework, explore the educational resources throughout Forex Trading Unlocked.
Start with the fundamentals:
Forex Trading Guide
Then build your price-action knowledge with:
High Probability Japanese Candlestick Patterns
Develop your chart-reading skills through:
Forex Support & Resistance
Learn structured trading setups with:
High Probability Forex Setups Using Candlesticks + Trend Shifts
And strengthen your most important defense with:
Forex Risk Management
The goal is not to collect dozens of indicators.
The goal is to develop a repeatable process that tells you:
WHEN to trade.
WHERE to enter.
WHERE the trade is invalidated.
WHERE to take profit.
HOW MUCH to risk.
Ready To Build A Better Forex Trading System?
The Sniper Entry/Exit with SL & TP Indicator can help organize potential entries, exits, stop-loss levels, and take-profit targets directly on your TradingView chart.
But the indicator is only one piece of the puzzle.
The real opportunity comes from learning how to combine technical analysis, price action, market structure, and risk management into a disciplined trading process.
Don't just chase signals. Learn the methodology behind the trade.
Explore the Forex Trading Unlocked education library, download the free trading resources, and continue building the skills necessary to analyze the Forex market with greater structure and discipline.Start Here:
→ Download The Free Forex Trading Starter Kit
→ Learn The 10 High Probability Japanese Candlestick Patterns
→ Explore High Probability Forex Setups
→ Master Forex Risk Management
→ Explore Forex Trading Strategies
→ Discover More TradingView Forex Indicators
Your next trade should never begin with:
“I wonder what this signal means?”
It should begin with:
“Does this trade meet my complete trading plan?”
That is the difference between simply following an indicator and developing a disciplined Forex trading process.
Important Trading Disclaimer
Forex and leveraged trading involve substantial risk and are not suitable for every trader. Technical indicators, trading strategies, signals, and educational materials cannot guarantee trading profits. Always conduct your own research, test strategies before using real money, and never risk more than you can afford to lose.
👉 “Get Instant Access (Check Your Email)”
💥 IMPORTANT: One Last Step Required
After you enter your email, check your inbox (or spam folder) for a confirmation email.
👉 Click the confirmation link so I can send you your free Forex training.
⚠️ If you don’t confirm, I can’t send you anything.
👉 “⚠️ Access expires if not confirmed within 24 hours minutes.”
👉 “Takes 10 seconds. Instant access after email confirmation.”