How To Use The TRIX Chart Divergence Indicator On TradingView In Forex Trading
The TRIX Chart Divergence Indicator on TradingView can help Forex traders identify momentum changes that may not be immediately obvious from price action alone.
When price continues moving in one direction while momentum begins telling a different story, the market may be approaching an important turning point.
That is where TRIX divergence becomes particularly interesting.
Instead of simply chasing price, traders can use divergence to investigate whether the underlying momentum is confirming the current trend—or quietly warning that the trend may be losing strength.
The goal is not to predict every market reversal.
The goal is to recognize when momentum and price begin moving out of alignment and then combine that information with a disciplined Forex trading strategy.
What Is the TRIX Indicator?
TRIX, short for Triple Exponential Average, is a momentum oscillator designed to filter some of the market noise that can make traditional momentum indicators difficult to interpret.
The indicator applies multiple levels of exponential smoothing to price before calculating its rate of change.
The result is a momentum-focused oscillator that can help traders study:
- Trend momentum
- Momentum acceleration and deceleration
- Potential bullish divergence
- Potential bearish divergence
- Changes in market direction
- Confirmation of existing Forex trends
TRIX can therefore become particularly useful when combined with price action, support and resistance, candlestick patterns, trend analysis, and other confirmation tools.
What Is TRIX Divergence?
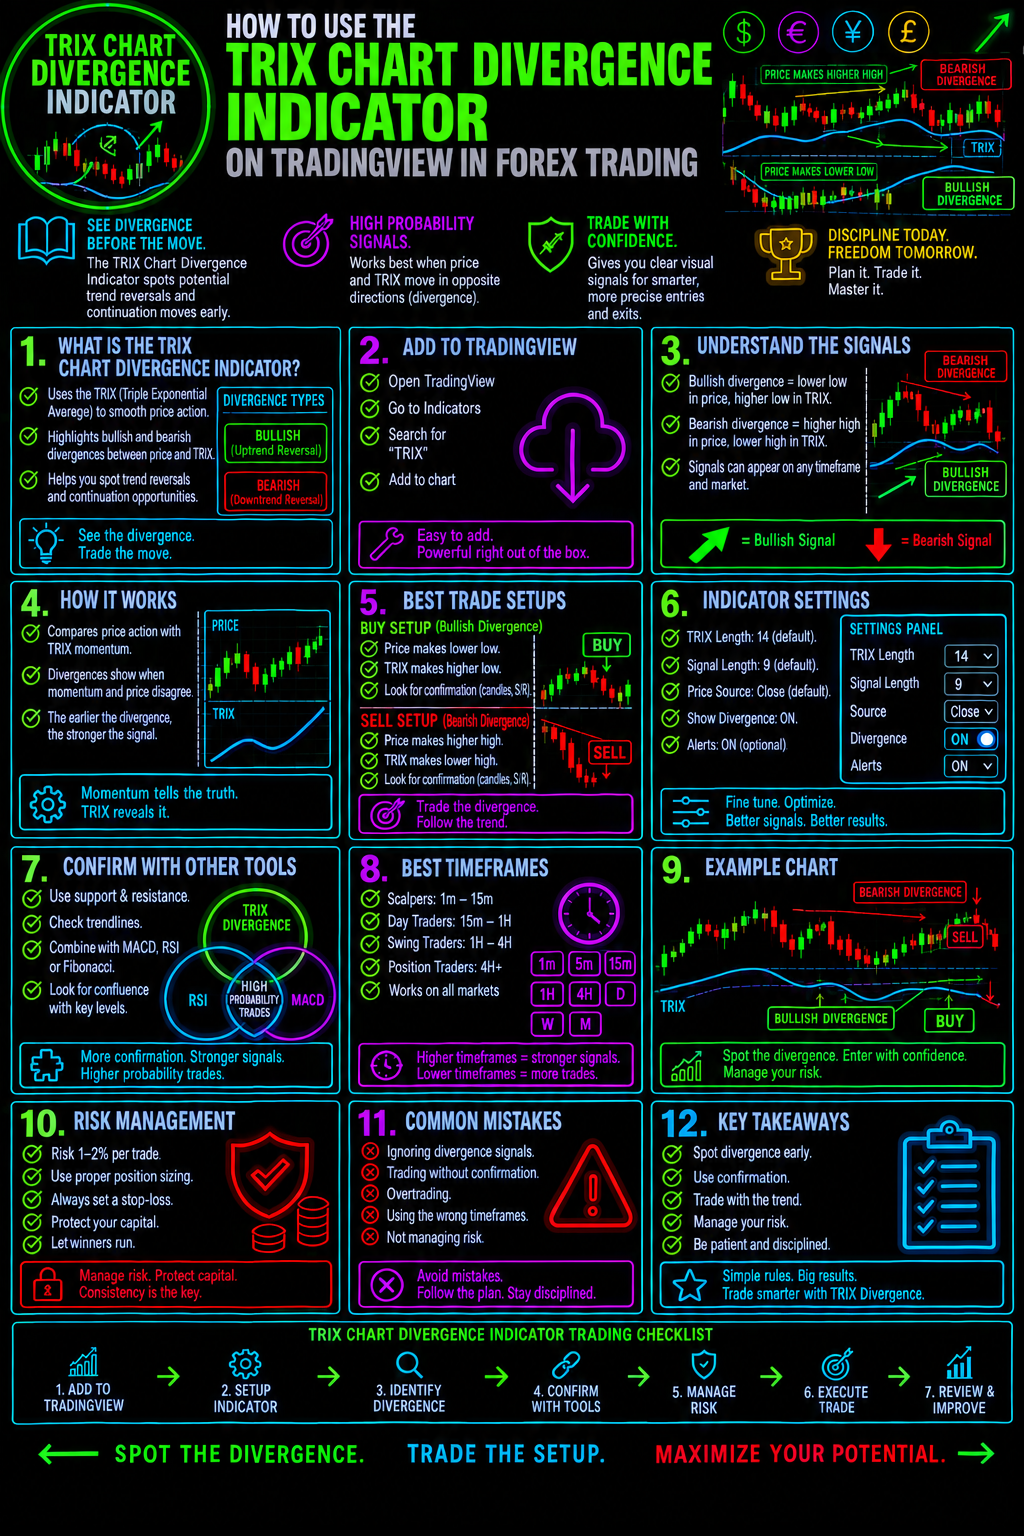
TRIX divergence occurs when the movement of price and the movement of the TRIX indicator begin telling different stories.
This disagreement can be extremely valuable.Bullish TRIX Divergence
Bullish divergence occurs when:
Price creates a lower low while TRIX creates a higher low.
This can suggest that bearish momentum is weakening even though price has continued declining.
It does not automatically mean that price will reverse upward.
Instead, it creates a potential warning that sellers may be losing control.
Traders can then look for additional confirmation from:
- Support levels
- Bullish candlestick patterns
- Trendline breaks
- Market structure
- Breakouts
- Higher lows
- Other momentum indicators
Bearish TRIX Divergence
Bearish divergence occurs when:
Price creates a higher high while TRIX creates a lower high.
Price is still rising, but the underlying momentum may be weakening.
Again, divergence is not a guarantee of a reversal.
It is a potential early warning signal that deserves further investigation.
Why TRIX Divergence Matters In Forex Trading
Forex markets can move aggressively.
A currency pair may appear extremely bullish while momentum is gradually deteriorating beneath the surface.
The opposite can also occur during powerful selloffs.
This is why simply looking at price can sometimes leave traders reacting after a major move has already occurred.
TRIX divergence provides another perspective.
Rather than asking only:
"Is price going up or down?"
You can also ask:
"Is momentum confirming what price is doing?"
That distinction can dramatically improve the quality of your market analysis.
How To Add The TRIX Chart Divergence Indicator On TradingView
TradingView provides traders with a powerful charting environment for technical analysis.
To begin analyzing TRIX divergence:
Open the currency pair you want to analyze.
Popular Forex pairs include:
Step 2: Select Indicators
Open the Indicators section within TradingView.
Search for the TRIX indicator or the specific TRIX Chart Divergence Indicator you want to use.
Step 3: Add The Indicator
Apply the indicator to your chart.
You will now have the TRIX momentum information available beneath the price chart.
Step 4: Adjust The Settings
Depending on the version of the indicator, you may have settings available for smoothing, length, signal calculations, divergence detection, and visual presentation.
Avoid changing settings simply because they make historical signals look better.
The objective is to develop settings that make sense for your trading timeframe and strategy.
How To Read The TRIX Chart Divergence Indicator
The most important skill is learning to compare price structure against TRIX structure.
Do not look at the indicator in isolation.
Look for relationships.Step 1: Identify The Current Trend
Before searching for divergence, determine whether the market is:
- Trending higher
- Trending lower
- Moving sideways
- Consolidating
- Breaking out
- Pulling back
Understanding the broader market environment provides essential context.
Step 2: Locate Important Price Highs And Lows
Mark significant swing highs and swing lows.
These are the areas where divergence becomes easier to recognize.
You are looking for meaningful structural points—not every tiny fluctuation.
Step 3: Compare Price With TRIX
Now compare the corresponding highs and lows on the TRIX indicator.
Ask:
Is price making a new extreme while TRIX fails to make a corresponding extreme?
If so, investigate further.
Step 4: Look For Confirmation
This is where disciplined traders separate a potential setup from a premature trade.
A divergence signal should ideally be combined with other evidence.
For example:
Bullish Setup
Price → Lower Low
TRIX → Higher Low
Support → Confirmed
Candlestick → Bullish
Market Structure → Improving
That creates a much stronger analytical case than divergence alone.
TRIX Bullish Divergence Forex Strategy
A potential bullish TRIX divergence setup can develop after an extended decline.
Imagine EUR/USD has been falling steadily.
Price reaches a previous support zone and creates a new swing low.
However, TRIX creates a higher low.
The market is now presenting an important discrepancy.
Price says:
"The decline continues."
TRIX says:
"Bearish momentum may be weakening."
Rather than immediately buying, wait for confirmation.
Potential confirmation can include a:
- Bullish engulfing candlestick
- Hammer
- Morning Star
- Break above resistance
- Break of a bearish trendline
- Higher low
- Strong momentum recovery
This creates a structured process instead of blindly trading divergence.
TRIX Bearish Divergence Forex Strategy
The same concept works in reverse.
Suppose GBP/USD has been rising strongly.
Price pushes to a new high.
However, TRIX fails to confirm the new high and forms a lower high.
This can indicate that bullish momentum is weakening.
The next step is not automatically selling the currency pair.
Instead, look for confirmation.
Potential confirmation could include:
- Bearish engulfing candlestick
- Shooting Star
- Evening Star
- Resistance rejection
- Trendline breakdown
- Lower high
- Break of market structure
The stronger the confirmation, the more meaningful the divergence becomes.
TRIX Divergence + Japanese Candlestick Patterns
One of the most powerful ways to improve divergence analysis is to combine TRIX with Japanese candlestick patterns.
Divergence tells you:
Momentum may be changing.
A candlestick pattern can tell you:
Price action may be responding.
For example:
Bearish TRIX Divergence + Shooting Star + Resistance
is considerably more interesting than bearish TRIX divergence appearing in the middle of an otherwise strong trend with no structural resistance.
Likewise:
Bullish TRIX Divergence + Hammer + Major Support
can provide a much stronger potential reversal setup.
This is precisely why understanding candlestick psychology can dramatically improve technical analysis.
Learn more with the [High Probability Japanese Candlestick Patterns] section of Forex Trading Unlocked and discover how price action can complement momentum-based analysis.
TRIX Divergence And Support & Resistance
Support and resistance can provide the market structure needed to put divergence into context.
Consider two scenarios.Scenario One
TRIX shows bearish divergence.
Price is approaching major resistance.
A bearish candlestick forms.
The market then breaks below short-term support.
That combination provides multiple pieces of evidence pointing toward potential weakness.Scenario Two
TRIX shows bearish divergence.
Price is breaking through major resistance with strong momentum.
There is no bearish price-action confirmation.
The market continues higher.
The divergence may simply have been an early warning rather than an immediate reversal signal.
Context matters.
Never allow a single indicator to make the entire trading decision.
TRIX Divergence Across Multiple Timeframes
One of the biggest advantages of TradingView is the ability to analyze multiple timeframes.
A trader might use:
Daily Chart → Major trend
4-Hour Chart → Market structure
1-Hour Chart → Setup
15-Minute Chart → Entry
The exact combination depends on your trading style.
The important principle is to understand where the potential divergence fits within the larger market structure.
A bullish divergence on a 15-minute chart does not automatically mean the daily trend has reversed.
It may simply represent a short-term countertrend move.
This is why multi-timeframe Forex analysis is so important.
TRIX Divergence For Scalping
Short-term Forex traders may use TRIX divergence to identify potential momentum changes on lower timeframes.
However, lower timeframes contain significantly more market noise.
A divergence that appears on a 5-minute chart can disappear quickly.
Scalpers should therefore consider combining TRIX with:
- Short-term support and resistance
- Market structure
- Volume or liquidity analysis
- Candlestick confirmation
- Tight risk management
- Higher-timeframe direction
The faster the timeframe, the more important confirmation becomes.
TRIX Divergence For Swing Trading
TRIX divergence can also be useful for swing traders searching for larger market turning points.
Higher-timeframe divergence may take longer to develop, but it can potentially provide a broader view of momentum conditions.
A trader might identify:
- An established uptrend
- Price reaching major resistance
- Bearish TRIX divergence
- A bearish reversal pattern
- A break in market structure
- A pullback
- A potential short setup
This approach shifts the focus away from predicting tops and bottoms and toward waiting for the market to prove that conditions are changing.
Common TRIX Divergence Trading Mistakes
Understanding what not to do is just as important as understanding the indicator.
Mistake #1: Trading Every Divergence
Not every divergence produces a major reversal.
Some result in nothing more than a temporary pullback.
Mistake #2: Ignoring The Trend
A bullish divergence during a powerful bearish trend can remain unresolved for a long time.
The same is true for bearish divergence during a strong bullish trend.
Mistake #2: Ignoring The Trend
A bullish divergence during a powerful bearish trend can remain unresolved for a long time.
The same is true for bearish divergence during a strong bullish trend.
Mistake #4: Ignoring Support And Resistance
Divergence becomes much more meaningful when it occurs at an important technical level.
Mistake #5: Using Poor Risk Management
Even excellent setups can fail.
Never allow a technical indicator to replace disciplined position sizing and risk management.
How To Build A Complete TRIX Forex Trading Setup
Rather than using TRIX as a standalone system, consider building a complete trading framework.
Market Direction
Determine the dominant trend.
Key Levels
Identify major support and resistance.
Momentum
Use TRIX to investigate whether momentum confirms the trend.
Divergence
Search for meaningful bullish or bearish divergence.
Price Action
Wait for a recognizable candlestick or structural confirmation.
Entry
Define the precise condition that must occur before entering.
Stop Loss
Determine where the trade idea becomes invalid.
Profit Target
Establish a logical target based on market structure and risk/reward.
Risk Management
Keep the amount risked on each trade controlled and consistent.
This transforms TRIX from an interesting indicator into one component of a complete trading process.
TRIX Divergence Is A Warning System—Not A Crystal Ball
This is perhaps the most important lesson.
Divergence does not predict the future.
It identifies a potential disconnect between price and momentum.
Sometimes that disconnect precedes a major reversal.
Sometimes it produces a shallow correction.
Sometimes price simply continues in the original direction.
The professional approach is therefore not:
"TRIX says reversal, so I buy."
It is:
"TRIX is showing divergence. Now I want to know whether price confirms the potential change."
That mindset can dramatically improve the way you use technical indicators.
Take Your Forex Technical Analysis Further
TRIX divergence is only one piece of the puzzle.
The strongest Forex traders develop multiple analytical skills and learn how those tools work together.
Explore more Forex Trading Unlocked resources covering:
Forex Trading Strategies
Build a structured approach to analyzing and trading the currency markets.
Japanese Candlestick Patterns
Learn how price action can reveal potential changes in market psychology.
Support & Resistance
Identify the price levels where buyers and sellers may become most active.
MACD & Divergence
Explore another powerful approach to momentum and divergence analysis.
Multi-Timeframe Forex Trading
Learn how to align short-term setups with larger market trends.
Forex Risk Management
Discover why controlling risk is more important than finding the perfect indicator.
Ready To Trade With More Confidence?
The objective of Forex Trading Unlocked isn't to give you another indicator to stare at.
It's to help you build a complete Forex trading process.
Indicators can help you identify opportunities.
Candlesticks can help you understand price action.
Support and resistance can help you define market structure.
Risk management can help you survive losing trades.
And a disciplined trading system brings those pieces together.
If you're serious about improving your Forex trading, don't stop with TRIX.
Continue exploring Forex Trading Unlocked, build your technical-analysis knowledge, and start putting the pieces together into a repeatable trading system.Start Here:
FREE FOREX TRADING STARTER KIT
Learn the foundational principles every Forex trader should understand before putting serious capital at risk.
[Get Your Free Forex Trading Starter Kit]
Final Thoughts On The TRIX Chart Divergence Indicator
The TRIX Chart Divergence Indicator on TradingView can be a valuable momentum-analysis tool for Forex traders.
Its greatest value comes from helping you recognize situations where price and momentum are no longer moving together.
Bullish divergence can alert traders to potentially weakening bearish momentum.
Bearish divergence can alert traders to potentially weakening bullish momentum.
But the best results come from combining TRIX divergence with market structure, support and resistance, Japanese candlestick patterns, trend analysis, multiple timeframes, and disciplined risk management.
Don't trade divergence simply because it appears on your screen.
Use divergence as the beginning of your analysis—not the end.
And when price finally confirms what momentum has been warning you about, you'll be in a far better position to make a disciplined trading decision.
👉 “Get Instant Access (Check Your Email)”
💥 IMPORTANT: One Last Step Required
After you enter your email, check your inbox (or spam folder) for a confirmation email.
👉 Click the confirmation link so I can send you your free Forex training.
⚠️ If you don’t confirm, I can’t send you anything.
👉 “⚠️ Access expires if not confirmed within 24 hours minutes.”
👉 “Takes 10 seconds. Instant access after email confirmation.”