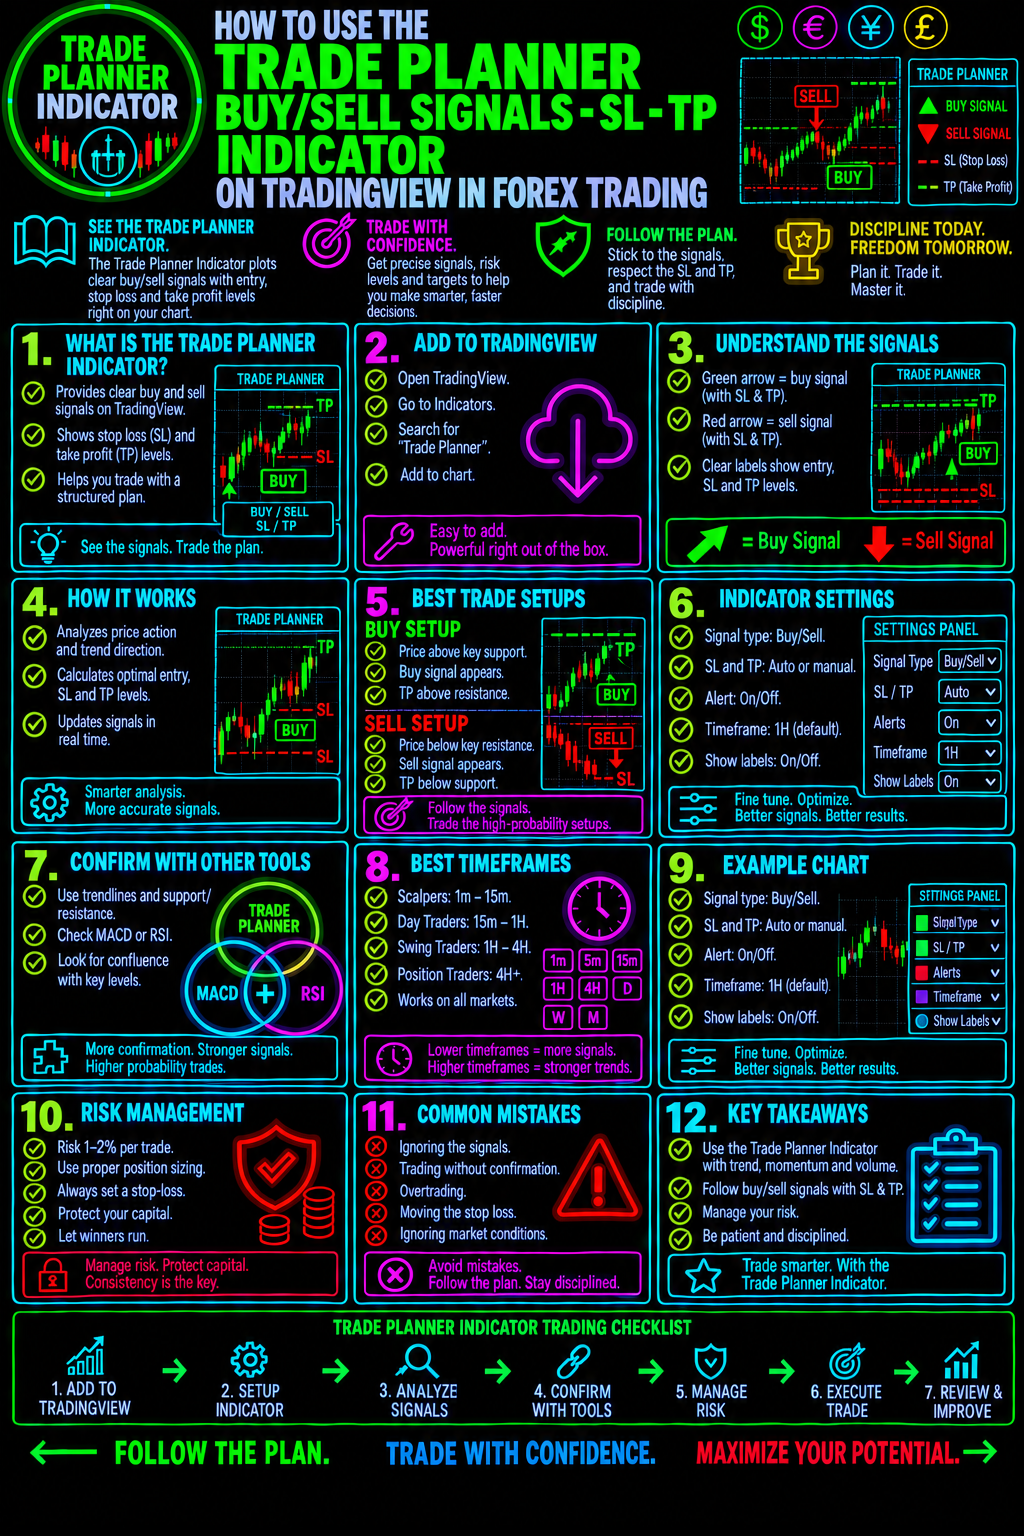
How To Use The Trade Planner Buy/Sell Signals SL/TP Indicator On TradingView In Forex Trading
Take the Guesswork Out of Forex Trade Planning With Buy/Sell Signals, Stop-Losses, and Take-Profit Levels
Successful forex trading is not just about knowing when to buy or sell. It is about planning your trade before you risk your money.
The Trade Planner Buy/Sell Signals SL/TP Indicator on TradingView is designed to help forex traders evaluate potential entry signals while organizing their stop-loss (SL) and take-profit (TP) levels. Used correctly, this type of indicator can help you develop a more structured approach to trade selection, risk management, and profit targets.
Whether you trade EURUSD, GBPUSD, USDJPY, or other major currency pairs, learning how to incorporate buy and sell signals into a complete trading plan can help you approach the forex market with greater discipline.
At Forex Trading Unlocked, our mission is to help traders move beyond guesswork and develop the skills, strategies, and risk-management habits needed to make better-informed trading decisions.
Explore the Trade Planner indicator, learn how to evaluate its signals, and discover how to incorporate trade planning into your overall forex trading strategy.
What Is the Trade Planner Buy/Sell Signals SL/TP Indicator?
The Trade Planner Buy/Sell Signals SL/TP Indicator is a TradingView charting tool intended to assist traders in evaluating potential buy and sell opportunities alongside stop-loss and take-profit planning.
Its specific features and calculations depend on the indicator's implementation and settings. Traders should consult the indicator's TradingView description to verify exactly how its signals and price levels are generated.
The indicator's intended functions can be understood through three essential components.
1. Buy Signals
A buy signal may identify a potential bullish trading opportunity. Traders can use the signal as a starting point for examining price action, market structure, trend direction, and nearby support levels.
A buy signal is not a guarantee that the market will rise. Before entering a trade, evaluate whether the potential setup offers a reasonable reward relative to the amount you could lose.
2. Sell Signals
A sell signal may highlight a potential bearish opportunity. Traders can use it to investigate downward momentum, resistance levels, bearish price patterns, and the broader market trend.
Before acting on a sell signal, determine whether the market conditions support the trade and whether a logical stop-loss level can be established.
3. Stop-Loss and Take-Profit Planning
Stop-loss and take-profit levels are central to a disciplined trading plan.
- Stop-loss (SL): Defines the price at which you intend to exit a trade to limit losses if the market moves against you.
- Take-profit (TP): Identifies a target price where you intend to close a profitable position.
- Risk-to-reward ratio: Compares the potential loss with the potential gain on a proposed trade.
Understanding these three components helps transform a potential signal into a trade plan with defined conditions.
How To Add the Trade Planner Indicator to TradingView
Before analyzing a currency pair, open your TradingView chart and locate the indicator.
Step 1: Open TradingView
Visit TradingView and open a chart for the forex currency pair you want to analyze.
Step 2: Select Your Currency Pair
Choose a pair such as EUR/USD, GBP/USD, or USD/JPY. Consider the pair's volatility, current trading session, and overall market conditions.
Step 3: Open the Indicators Menu
Select the Indicators button on the TradingView chart.
Step 4: Search for the Indicator
Search for the exact name Trade Planner Buy/Sell Signals SL/TP. Confirm that you have selected the intended indicator rather than a similarly named script.
Step 5: Add the Indicator to Your Chart
Select the indicator to display it on your chart. If it is invite-only or requires access from its author, follow the access instructions provided on TradingView.
Step 6: Review the Settings
Examine the available inputs, signal options, and display settings. Do not assume that the indicator automatically calculates optimal stop-loss or take-profit levels. Verify how its features work before using them in a live trading environment.
How To Interpret Buy and Sell Signals in Forex Trading
A signal is only the beginning of your analysis. Your objective is to determine whether the potential trade makes sense within the current market environment.Evaluating a Buy Setup
When a potential buy signal appears, ask yourself:
- Is the currency pair forming higher highs and higher lows?
- Is price trading above an important support level?
- Does the higher timeframe support a bullish outlook?
- Is there enough room for the market to move toward a realistic profit target?
- Can you define a stop-loss level that fits your risk limits?
If the signal appears directly beneath strong resistance or against a powerful bearish trend, the trade may offer an unfavorable opportunity.
Wait for sufficient confirmation rather than entering a position simply because an indicator displays a buy signal.
Evaluating a Sell Setup
When a potential sell signal appears, consider the opposite conditions:
- Is the market forming lower highs and lower lows?
- Is price rejecting an important resistance level?
- Does the broader trend support bearish price action?
- Is there sufficient distance to a logical downside target?
- Can the stop-loss be placed at a level that invalidates your trade idea?
A sell signal that appears directly above major support may offer limited downside potential. Understanding nearby price levels can help you avoid pursuing trades with insufficient reward potential.
Confirm Signals With Price Action
Price action can provide important context that an indicator signal alone may not capture.
Consider combining your analysis with support and resistance, trendlines, candlestick patterns, and multi-timeframe confirmation.
Explore our guide to High-Probability Japanese Candlestick Patterns to learn how candlestick formations can help you evaluate potential market reversals, continuation patterns, and changes in buying or selling pressure.
The objective is not to collect as many indicators as possible. It is to develop a repeatable process for identifying and evaluating trading opportunities.
How To Use Stop-Loss Levels (SL) Effectively
One of the most important decisions in forex trading is determining where a trade idea is no longer valid.
A stop-loss helps define that point before you enter the market.
Place Your Stop-Loss Around Trade Invalidation
A stop-loss should be based on the structure of the trade, not an arbitrary number of pips.
Depending on the setup, traders may consider placing a stop beyond a recent swing low for a buy trade or beyond a recent swing high for a sell trade.
The exact placement depends on volatility, market structure, the currency pair, and the timeframe.
A stop that is too tight may be triggered by ordinary price fluctuations. A stop that is too wide may expose your account to more risk than you can reasonably accept.
Calculate Your Position Size Before Entering
Your position size should reflect your stop-loss distance and your predetermined account risk.
For example, suppose your trading account contains $10,000 and you choose to risk 1% on a trade.
- Account balance: $10,000
- Risk per trade: 1%
- Maximum planned loss: $100
If the stop-loss is reached, the intended loss is approximately $100 before commissions, spreads, slippage, and other trading costs, assuming the position size has been calculated correctly and execution occurs as expected.
This is why position sizing is just as important as choosing an entry signal.
Read our forex trading resources and make risk management part of every trading decision. A promising signal cannot compensate for excessive position sizing or an uncontrolled loss.
How To Set Take-Profit Levels (TP)
A take-profit target provides a predefined objective for a potential trade.
Rather than entering the market and hoping for a favorable outcome, identify where the trade could reasonably reach its target before committing capital.
Use Support and Resistance
For a buy trade, potential targets may include resistance zones, previous swing highs, or other areas where selling pressure could emerge.
For a sell trade, possible targets may include support zones, previous swing lows, or areas where buying pressure could return.
These levels are potential areas of interest, not guaranteed reversal points.
Understand Risk-to-Reward Ratios
Risk-to-reward analysis compares the amount you plan to risk with the amount you intend to gain if the target is reached.
For example, consider a trade with:
- Entry price: 1.1000
- Stop-loss: 1.0950
- Take-profit: 1.1100
The planned risk is 50 pips, while the potential reward is 100 pips.
That creates a 2:1 reward-to-risk ratio before trading costs.
The ratio can help you compare potential setups, but a favorable ratio does not automatically make a trade profitable. Your results also depend on the probability of reaching the target, execution quality, and consistency over a series of trades.
Do Not Move Targets Without a Plan
Changing a take-profit target because you hope to make more money can undermine a disciplined strategy.
Define your exit conditions before entering. If your strategy allows adjustments as the market develops, establish clear rules for making those changes.
A Step-by-Step Forex Trading Strategy Using Trade Planner
You can use the indicator as one component of a structured trading process.
Step 1: Identify the Market Trend
Begin with the higher timeframe to determine whether the market is trending upward, trending downward, or moving sideways.
Mark significant support and resistance zones before examining lower-timeframe entries.
Step 2: Wait for a Potential Buy or Sell Signal
Allow the indicator to identify a possible setup according to its own signal rules.
Avoid forcing a trade when no suitable opportunity appears. Remaining out of the market is a valid trading decision.
Step 3: Confirm the Setup
Evaluate the signal against price action, trend direction, and nearby market structure.
Check whether an upcoming economic announcement could create unusually volatile conditions.
Step 4: Define Your Stop-Loss
Determine where the trading idea would be invalidated. Calculate the distance from your proposed entry to the stop-loss.
Step 5: Identify a Realistic Take-Profit Target
Look for logical target areas based on support, resistance, recent price swings, and your trading strategy.
Calculate the potential reward relative to the planned risk.
Step 6: Calculate Your Position Size
Determine the position size that keeps your planned loss within your account risk limit.
Never increase position size simply because the indicator appears especially convincing.
Step 7: Execute and Manage the Trade
If the setup meets your rules, execute the trade according to your plan. Follow your predefined exit and risk-management conditions.
Step 8: Record and Review the Outcome
Record the signal, currency pair, timeframe, entry, stop-loss, target, and result.
Review a sufficiently large sample of trades to determine whether the indicator adds value to your process. Include losing trades in your evaluation rather than judging the tool solely by its most successful examples.
Which Forex Timeframes Should You Use?
The most appropriate timeframe depends on your trading style, available time, and tested strategy.
Scalping: Shorter timeframes may offer frequent setups but can also produce more market noise and greater sensitivity to spreads and execution costs.
Day trading: Intraday charts may help traders evaluate potential entries and exits within a single trading session.
Swing trading: Higher timeframes can help traders focus on broader price movements and setups that may take several days to develop.
Regardless of timeframe, confirm how the indicator behaves on historical data and in live market conditions. Check whether signals repaint, appear only after a candle closes, or change as new price data arrives.
These details can materially affect the difference between an attractive historical chart and a strategy that can be executed in real time.
Common Mistakes To Avoid When Using Buy/Sell Indicators
Even a useful charting tool can lead to poor decisions when it is used without a consistent process.
Mistake 1: Treating Every Signal as a Trade
Not every buy or sell signal represents a high-quality opportunity. Consider market structure, volatility, and the potential reward before entering.
Mistake 2: Ignoring Stop-Loss Placement
Entering a position without defining the maximum planned loss exposes your account to unnecessary risk.
Mistake 3: Using Excessive Leverage
Leverage can magnify both gains and losses. Keep your position size aligned with your risk limits instead of using the largest position your broker permits.
Mistake 4: Ignoring Economic News
Interest-rate decisions, inflation releases, employment reports, and central bank announcements can trigger sharp currency movements.
Understand the economic calendar and determine whether your strategy is designed to operate during major news events.
Mistake 5: Changing Your Rules After a Losing Trade
A losing trade does not automatically mean your strategy has failed. Evaluate the quality of the setup and whether you followed your rules.
Avoid revenge trading, impulsive re-entry, and increasing risk to recover losses.
Mistake 6: Failing To Backtest
Test the indicator across different market conditions and currency pairs where appropriate. Include realistic spreads, commissions, slippage, and execution assumptions.
If historical signals change after the fact, account for that behavior when evaluating results.
Combine Trade Planning With High-Probability Forex Setups
A buy/sell indicator can help organize your analysis, but a complete trading method requires more than entry signals.
Forex Trading Unlocked provides educational resources designed to help traders understand market structure, technical analysis, candlestick patterns, and risk management.
Explore these related resources:
- High-Probability Japanese Candlestick Patterns: Learn to recognize important candlestick formations and understand how they fit into price-action analysis.
- Forex Trading: Build your understanding of currency markets, trading techniques, and the foundations of forex trading.
- The Ultimate Chart Patterns Forex Trading Course: Develop your chart-reading skills by studying formations that traders use to evaluate potential continuation and reversal opportunities.
- Forex Trading Unlocked: Explore our educational resources, trading guides, and tools for developing a more structured approach to the currency markets.
The more effectively you understand price action and risk management, the better equipped you will be to judge whether a buy or sell signal fits your strategy.
Get Your Free Forex Trading Starter Kit
Want to develop a stronger foundation before putting another trade at risk?
Get the Free Forex Trading Starter Kit from Forex Trading Unlocked.
Use this educational resource to strengthen your understanding of forex trading fundamentals and the importance of protecting your trading capital.
Your goal should not be to take every trade. It should be to recognize suitable opportunities, manage risk consistently, and build a repeatable trading process.
Visit Forex Trading Unlocked and get started.
Frequently Asked Questions
What does the Trade Planner Buy/Sell Signals SL/TP Indicator do?
It is a TradingView indicator intended to help traders evaluate potential buy and sell signals and organize stop-loss and take-profit planning. Its precise features and calculation methods depend on the specific script and its settings.
Is the Trade Planner indicator suitable for beginners?
Beginners can use it as an educational tool while learning about entries, exits, and trade planning. However, they should understand position sizing, leverage, stop-loss placement, and the limitations of technical indicators before trading live funds.
Does the indicator guarantee profitable forex trades?
No. No indicator can guarantee profits or eliminate trading risk. Signals can fail, market conditions can change, and execution costs can reduce returns.
Can I use the indicator on EURUSD and GBPUSD?
If the indicator supports the relevant TradingView charts, it may be used to analyze currency pairs such as EUR/USD and GBP/USD. Test its behavior separately on each pair because volatility, liquidity, and price characteristics can differ.
How do I determine the correct stop-loss level?
Choose a level that reflects the conditions that would invalidate your trade idea, taking market structure and volatility into account. Then calculate your position size so that the planned loss remains within your predetermined risk limit.
What is a good risk-to-reward ratio?
Some traders look for setups offering potential rewards greater than their planned risk, such as 2:1. The appropriate ratio depends on the strategy, win rate, trading costs, and execution. No single ratio guarantees profitability.
Should I use the indicator alone?
It is generally more prudent to evaluate an indicator alongside price action, market structure, risk management, and a tested trading plan. Additional indicators should be used only when they contribute useful information rather than duplicate existing signals.
Can I use the indicator on every timeframe?
Timeframe compatibility and signal behavior depend on the indicator's implementation. Test the script on the timeframes you intend to trade and verify whether its signals remain stable after candles close.
Final Thoughts: Turn Forex Signals Into a Structured Trading Plan
The Trade Planner Buy/Sell Signals SL/TP Indicator on TradingView can serve as a starting point for organizing potential forex entries, stop-losses, and profit targets.
The real value comes from how you use it.
Evaluate the market before acting on a signal. Define your risk before entering a trade. Establish a realistic target. Calculate your position size. Then review your results to determine whether your approach is delivering the performance you expect.
Trade with a plan. Manage your risk. Keep improving your skills.
Explore more forex trading education, technical analysis resources, and trading strategies at Forex Trading Unlocked and take the next step toward a more disciplined approach to forex trading.
Risk Disclosure: Forex trading involves substantial risk and is not suitable for every investor. Leverage can magnify losses, including losses that exceed your initial expectations depending on your product and broker terms. Technical indicators provide no guarantee of future performance. This article is for educational purposes only and does not constitute investment advice or a recommendation to buy or sell any financial instrument.
👉 “Get Instant Access (Check Your Email)”
💥 IMPORTANT: One Last Step Required
After you enter your email, check your inbox (or spam folder) for a confirmation email.
👉 Click the confirmation link so I can send you your free Forex training.
⚠️ If you don’t confirm, I can’t send you anything.
👉 “⚠️ Access expires if not confirmed within 24 hours minutes.”
👉 “Takes 10 seconds. Instant access after email confirmation.”