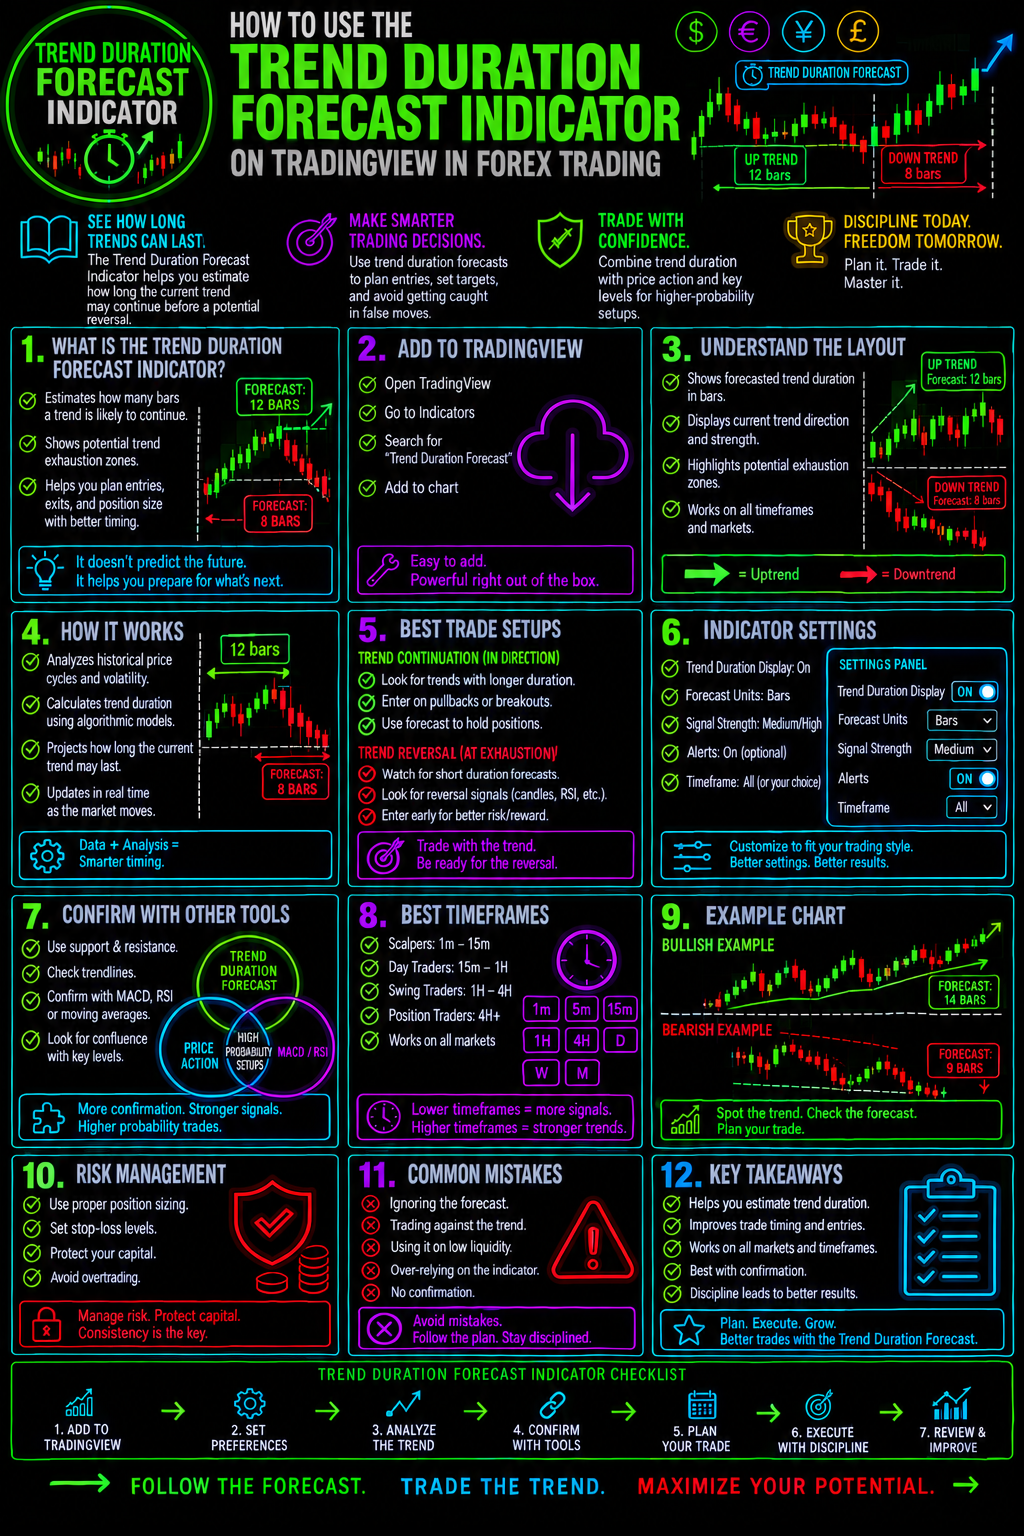
How To Use The Trend Duration Forecast Indicator On TradingView In Forex Trading
Master The Trend Before The Trend Masters You
Knowing which direction the Forex market is moving is only part of the trading equation.
The bigger question is:
How long could that trend continue?
The Trend Duration Forecast Indicator on TradingView is designed to help traders analyze the potential duration and strength of an existing market trend. Used correctly, it can add another layer of information to your technical analysis and help you avoid entering trades blindly.
But an indicator should never become a reason to enter a trade by itself.
The real advantage comes from combining trend-duration analysis with price action, support and resistance, market structure, momentum, and disciplined risk management.
In this guide, you'll learn how to use the Trend Duration Forecast Indicator in Forex trading, how to interpret its signals, where it can fit into a trading strategy, and how to combine it with other powerful tools.
What Is The Trend Duration Forecast Indicator?
The Trend Duration Forecast Indicator is a TradingView-based technical analysis tool designed to help traders evaluate how long a prevailing trend may continue.
Traditional trend indicators primarily answer:
Is the market bullish or bearish?
A trend-duration approach asks another important question:
Is the current trend potentially early, mature, or approaching exhaustion?
That distinction can become extremely important when trading Forex.
A strong bullish trend does not automatically mean that buying immediately is the best decision.
Likewise, a strong bearish trend does not automatically mean that selling at the current price is ideal.
Trend duration can provide additional context when deciding whether a market is potentially:
- Beginning a trend
- Continuing an established trend
- Entering a mature trend
- Losing momentum
- Approaching a potential reversal
- Better suited for continuation trades or waiting for confirmation
Why Trend Duration Matters In Forex Trading
Forex markets can trend for hours, days, or even weeks.
One of the biggest mistakes traders make is treating every trend as though it has unlimited room to run.
It doesn't.
Markets move through different phases.
A currency pair can establish a trend, accelerate, consolidate, and eventually reverse or transition into another market condition.
Understanding trend duration can therefore help traders place the current price action into a broader context.
For example:Early Trend
A developing trend may provide an opportunity to look for a continuation setup.Established Trend
An established trend may offer multiple opportunities to trade pullbacks rather than chase price.Mature Trend
A mature trend may require greater caution because the risk of a consolidation or reversal could increase.
The indicator does not predict the future with certainty.
Instead, it should be viewed as another piece of evidence inside a larger trading decision.
How To Add The Trend Duration Forecast Indicator To TradingView
Getting started is straightforward.3
Step 1: Open TradingView
Open your TradingView chart and select the Forex currency pair you want to analyze.
Step 2: Open Indicators
Select the Indicators menu at the top of the chart.
Step 3: Search For The Indicator
Enter:
Trend Duration Forecast
into the indicator search field.
Step 4: Add The Indicator
Select the appropriate Trend Duration Forecast Indicator and add it to your chart.
Step 5: Configure The Settings
Review the available settings and adjust them according to your trading timeframe and strategy.
Avoid immediately changing every parameter.
Start with the default settings and learn how the indicator behaves before attempting to optimize it.
How To Read The Trend Duration Forecast Indicator
The exact presentation can depend on the version of the indicator and its settings, but the underlying concept is straightforward.
You want to evaluate the relationship between:
Trend Direction + Trend Duration + Price Structure + Momentum
Rather than interpreting one reading in isolation.
A bullish trend-duration reading can support a bullish market thesis.
A bearish reading can support a bearish market thesis.
But the strongest trading decisions generally occur when several independent pieces of evidence agree.
The Trend Duration Forecast Indicator Trading Strategy
The simplest way to use the indicator is as a trend-context filter.
Instead of asking:
"Should I buy?"
Ask:
"Does the broader market condition support looking for long setups?"
Then allow price action to provide the actual entry.
For example:Bullish Scenario
- The currency pair establishes a bullish structure.
- The Trend Duration Forecast Indicator supports the bullish trend.
- Price pulls back toward support.
- A bullish price-action signal develops.
- Momentum confirms the setup.
- Risk is defined before entering.
- The trade is executed only if the complete setup meets your rules.
This approach is significantly more disciplined than buying simply because an indicator displays a bullish condition.
Using The Indicator With Support And Resistance
One of the strongest ways to increase the usefulness of trend-duration analysis is to combine it with support and resistance.
Consider a EUR/USD bullish trend.
The Trend Duration Forecast Indicator suggests the trend remains supportive of bullish conditions.
Price then pulls back toward a previously established support zone.
Instead of buying immediately, the trader waits for price to demonstrate that buyers are actually defending the level.
That creates a potential confluence:
Trend Direction + Trend Duration + Support + Price Action
The same principle applies to bearish setups.
A bearish trend combined with resistance can create a much more compelling short-selling environment than a bearish indicator reading by itself.
Using Trend Duration With Market Structure
Market structure should remain one of the foundations of your analysis.
Look for:
- Higher highs
- Higher lows
- Lower highs
- Lower lows
- Breaks of structure
- Changes in market structure
- Consolidation ranges
A bullish trend-duration reading accompanied by higher highs and higher lows provides stronger context than the indicator alone.
Likewise, a bearish duration reading accompanied by lower highs and lower lows provides additional confirmation.
But if the indicator says bullish while price is repeatedly breaking bullish structure, that conflict deserves attention.
When indicators and price disagree, don't ignore the disagreement. Investigate it.
Using The Indicator With Moving Averages
Moving averages can provide another layer of trend confirmation.
For example, traders may use a moving average to identify the broader directional bias while using the Trend Duration Forecast Indicator to assess the persistence of that trend.
A potential bullish environment could include:
- Price above the moving average
- Bullish market structure
- Positive trend-duration conditions
- Pullback toward dynamic support
A bearish environment could include:
- Price below the moving average
- Bearish market structure
- Negative trend-duration conditions
- Rally into dynamic resistance
The objective isn't to add as many indicators as possible.
The objective is to create confluence without creating confusion.
Using Trend Duration With RSI
The Relative Strength Index can provide useful momentum context.
Imagine a currency pair has been trending higher and the Trend Duration Forecast Indicator continues supporting the trend.
RSI remains constructive.
Price continues creating higher lows.
A pullback then develops.
That could create a potential continuation environment.
However, if the trend appears extremely mature and RSI begins showing weakening momentum, the trader may become more cautious about chasing the move.
This is where trend duration becomes particularly interesting.
A trend can remain bullish while becoming less attractive to enter.
Those are two very different concepts.
Using The Trend Duration Forecast Indicator With MACD
MACD can help traders evaluate momentum and trend conditions.
A potential bullish confluence could involve:
Trend Duration Forecast → Bullish
Market Structure → Bullish
MACD → Bullish Momentum
Price Action → Bullish Confirmation
When multiple factors point in the same direction, traders can potentially filter out lower-quality setups.
For bearish conditions, reverse the framework.
The goal is not prediction perfection.
The goal is probability management.
Trend Continuation Strategy
One of the most practical applications is identifying potential continuation trades.
Step 1 — Identify The Trend
Determine whether the currency pair is structurally bullish or bearish.
Step 2 — Check Trend Duration
Use the indicator to determine whether the trend appears to have continuation characteristics or whether it may be becoming mature.
Step 3 — Wait For A Pullback
Avoid chasing extended price movement.
Wait for price to return toward a meaningful technical area.
Step 4 — Find Confirmation
Look for price-action confirmation such as:
- Rejection candles
- Engulfing patterns
- Break-and-retest structures
- Higher lows
- Lower highs
- Momentum confirmation
Step 5 — Define Risk
Determine your stop-loss location before entering.
Step 6 — Establish The Target
Use structure, support, resistance, Fibonacci levels, or another objective method to establish potential profit targets.
Step 6 — Establish The Target
Use structure, support, resistance, Fibonacci levels, or another objective method to establish potential profit targets.
Trend Reversal Strategy
The indicator can also become useful when evaluating whether an established trend is potentially losing strength.
But this requires caution.
A trend-duration reading suggesting maturity does not mean a reversal has occurred.
Instead, look for confirmation.
For example:
Mature Trend
↓
Momentum Weakens
↓
Price Breaks Market Structure
↓
Retest Fails
↓
Reversal Confirmation
That sequence provides considerably more information than simply assuming:
"The trend has lasted a long time, so it must reverse."
Markets can remain overextended longer than traders expect.
Multi-Timeframe Trading With Trend Duration
One of the most powerful ways to improve technical analysis is to stop viewing the market from only one timeframe.
Consider using:Higher Timeframe
Determine the broader market trend.Middle Timeframe
Identify the active trading structure.Lower Timeframe
Search for precise entries.
For example:
Daily → 4-Hour → 1-Hour
or
4-Hour → 1-Hour → 15-Minute
The exact combination should depend on your trading style.
The important principle is:
Use the higher timeframe for context and the lower timeframe for execution.
A Powerful Forex Confluence Model
The Trend Duration Forecast Indicator can become part of a broader trading framework:
1. Market Direction
What is the dominant trend?
2. Trend Duration
How mature does the trend appear?
3. Market Structure
Are highs and lows supporting the trend?
4. Key Levels
Where are support and resistance?
5. Momentum
Is momentum confirming or contradicting the move?
6. Price Action
Is there an actual entry signal?
7. Risk
Does the potential reward justify the amount being risked?
8. Execution
Does the setup meet your complete trading plan?
This transforms the indicator from a standalone signal generator into a decision-support tool.
Common Mistakes Traders Make
Mistake #1: Treating The Indicator As A Crystal Ball
No indicator knows exactly what the Forex market will do next.
Forecasting is probability—not certainty.
Mistake #2: Entering Because The Trend Is Bullish
A bullish trend can still produce a terrible entry.
Wait for price to come to you.
Mistake #3: Ignoring Market Structure
Indicators can change while market structure tells a completely different story.
Always understand what price is doing.
Mistake #4: Trading Without A Stop-Loss
A good indicator cannot protect an oversized position.
Risk management comes first.
Mistake #5: Over-Optimizing Settings
Changing settings until historical results look perfect can create a dangerous illusion.
A strategy must survive real market conditions.
Mistake #6: Using Too Many Indicators
Adding ten indicators does not necessarily create ten times more confirmation.
It can create ten times more confusion.
Best Forex Pairs To Test The Indicator
The Trend Duration Forecast Indicator can be evaluated across major currency pairs such as:
You can also test it on cross pairs and other markets available through TradingView.
However, don't assume that an indicator will behave identically across every currency pair.
Backtesting matters.
Which Timeframe Is Best?
There is no universally perfect timeframe.
Scalpers
May investigate lower timeframes such as 1-minute, 5-minute, or 15-minute charts.
Day Traders
May focus on 15-minute, 1-hour, and 4-hour charts.
Day Traders
May focus on 15-minute, 1-hour, and 4-hour charts.
Position Traders
May use daily and weekly charts.
The best timeframe is ultimately the one that matches your strategy, risk tolerance, available time, and trading objectives.
How To Backtest The Trend Duration Forecast Indicator
Before risking real capital, test the indicator systematically.
Create a set of rules.
For example:
Entry: Trend-duration condition + market structure + price-action confirmation.
Stop: Beyond the invalidation level.
Target: Predefined technical objective.
Then record every trade.
Track:
- Win rate
- Average win
- Average loss
- Maximum drawdown
- Risk-to-reward ratio
- Number of trades
- Consecutive losses
- Performance by currency pair
- Performance by timeframe
- Performance by market condition
The goal isn't to find a perfect indicator.
The goal is to determine whether your complete trading system has an edge.
Trend Duration Forecast Indicator + Forex Trading Unlocked
If you're serious about becoming a better Forex trader, don't stop with one indicator.
Build a complete technical-analysis toolkit.
Explore more Forex Trading Unlocked resources covering:
Forex Trading For Beginners
Learn the foundations before risking capital.
Japanese Candlestick Patterns
Discover how price-action formations can reveal potential market behavior.
Support & Resistance
Learn how key price levels can become the foundation of trade setups.
MACD Forex Trading
Use momentum and trend analysis to strengthen technical confirmation.
Fibonacci Forex Trading
Explore retracement and extension levels for potential trade locations.
Market Structure
Learn how highs, lows, breakouts, and structural shifts can improve your analysis.
Forex Risk Management
Because protecting your trading capital is more important than finding the next trade.
Turn Indicators Into A Trading System
The biggest mistake is collecting indicators without developing a process.
You don't need another flashing signal.
You need a repeatable trading framework.
The Trend Duration Forecast Indicator can help answer one important question:
Does the current trend appear capable of continuing?
Then your trading system must answer the rest:
Where do I enter?
Where am I wrong?
Where do I take profits?
How much do I risk?
What confirms the setup?
When should I stay out?
That is where technical analysis becomes a trading plan.
Final Thoughts
The Trend Duration Forecast Indicator on TradingView can provide valuable context when analyzing Forex trends.
Its greatest potential isn't necessarily predicting exactly when a trend will end.
Its value comes from helping traders think differently about trend conditions, trend maturity, continuation opportunities, and potential changes in market behavior.
Use it alongside market structure, support and resistance, price action, momentum, multi-timeframe analysis, and disciplined risk management.
Never let one indicator make the entire trading decision.
Build the evidence. Wait for confirmation. Define your risk. Then execute.
And if you're ready to go beyond individual indicators and build a more complete Forex trading process, continue exploring the Forex Trading Unlocked education library and discover the strategies, indicators, candlestick patterns, and market-analysis tools designed to help you trade with greater structure and confidence.Your Next Move
Don't just add another indicator to your chart.
Learn how to make every indicator work as part of a bigger trading system.
Explore more Forex Trading Unlocked strategies, Forex education, TradingView indicators, and advanced technical-analysis resources today.
👉 “Get Instant Access (Check Your Email)”
💥 IMPORTANT: One Last Step Required
After you enter your email, check your inbox (or spam folder) for a confirmation email.
👉 Click the confirmation link so I can send you your free Forex training.
⚠️ If you don’t confirm, I can’t send you anything.
👉 “⚠️ Access expires if not confirmed within 24 hours minutes.”
👉 “Takes 10 seconds. Instant access after email confirmation.”