How To Use The Weekly Profile Indicator [Side Pannel] On TradingView In Forex Trading
Master Weekly Market Structure. Identify Key Price Levels. Build a Smarter Forex Trading Plan.
Successful forex trading is not about chasing every price movement. It is about understanding where the market has been, where important price levels are located, and how price behaves when it returns to those areas.
The Weekly Profile Indicator on TradingView can help traders organize market information around a weekly reference period, identify potentially important price zones, and develop a more structured approach to forex market analysis.
Whether you trade EUR/USD, GBP/USD, USD/JPY, or other major currency pairs, understanding weekly price behavior can help you put short-term market movements into a broader context.
On this page, you will learn how to use the Weekly Profile Indicator, interpret its information, combine it with price action and technical analysis, and develop a practical trading process.
Ready to sharpen your forex trading skills? Forex Trading Unlocked provides the educational resources, technical analysis lessons, and trading strategies you need to approach the currency markets with greater structure and discipline.
What Is the Weekly Profile Indicator?
The Weekly Profile Indicator is a TradingView charting tool designed to help traders analyze price activity over a weekly period. Depending on the specific script and its settings, a weekly profile may display information such as price distribution, important reference levels, or the relationship between price and the week's trading range.
The exact features depend on the indicator's implementation. Some profile tools emphasize volume distribution, while others focus on weekly highs and lows, price zones, or market structure.
The purpose is to help traders move beyond isolated candles and examine how price develops throughout the week.
When used correctly, weekly analysis can help you:
- Establish a broader market context before entering a trade.
- Identify weekly reference levels that deserve attention.
- Recognize potential support and resistance areas.
- Evaluate price reactions around previously established levels.
- Plan intraday and swing trades with a clearer analytical framework.
- Avoid making trading decisions based entirely on short-term price fluctuations.
Remember: an indicator provides information, not certainty. No weekly profile level guarantees that price will reverse, continue, or reach a particular target.
Why Weekly Analysis Matters In Forex Trading
Forex markets operate around the clock during the trading week. Currency prices respond to economic releases, central bank decisions, interest-rate expectations, geopolitical developments, and changes in market sentiment.
A five-minute chart may show several rapid price movements that appear significant in isolation. A weekly chart can help reveal whether those movements are occurring near a broader market reference point or within a larger directional move.
This is where weekly analysis becomes valuable.
For example, imagine EUR/USD has been trending upward throughout the week. Price then pulls back toward a previously identified weekly reference area.
Instead of immediately buying or selling, you can evaluate the broader trend, inspect the price reaction, and look for confirmation on a lower timeframe.
This creates a more systematic process:
- Identify the broader market environment.
- Mark relevant weekly reference levels.
- Wait for price to approach an area of interest.
- Look for confirmation using price action or another technical tool.
- Define your entry, stop-loss, and profit target before placing a trade.
The objective is not to predict every move. It is to prepare for the moves that meet your trading criteria.
How To Add The Weekly Profile Indicator On TradingView
TradingView provides a charting environment where traders can apply indicators and analyze multiple timeframes.
Follow these steps to locate and configure a Weekly Profile Indicator.
Step 1: Open TradingView
Open TradingView and load the chart for the currency pair you want to analyze.
Start with a liquid major pair such as EUR/USD or GBP/USD if you are learning how weekly analysis works.
Step 2: Open The Indicators Menu
Select the Indicators button on the chart toolbar.
Search for the Weekly Profile Indicator or the specific weekly profile script you intend to use.
TradingView contains scripts created by different developers, so verify that you have selected the intended indicator rather than assuming every script with a similar name uses the same calculations.
Step 3: Add The Indicator To Your Chart
Select the appropriate script and apply it to your chart.
Review the indicator's displayed elements and settings. Depending on the script, these may include weekly boundaries, price levels, profile areas, or other reference information.
If the script is unavailable or requires access permission, consult its TradingView publication page for the developer's instructions.
Step 4: Configure The Settings
Open the indicator settings and review the available options.
Common settings may include the profile period, visual presentation, historical display, or the levels shown on the chart. The actual options vary by script.
Avoid changing multiple settings simultaneously. Begin with the default configuration, learn what each displayed element represents, and make adjustments only when you understand their purpose.
Step 5: Compare Weekly And Lower Timeframes
Use a higher timeframe to understand the broader context, then move to a four-hour, one-hour, or lower timeframe when looking for a potential entry.
The weekly profile should support your analysis rather than replace it.
How To Read The Weekly Profile Indicator
The most important step is understanding what the specific indicator actually measures.
Before using any displayed level, read its description and determine whether it represents a price extreme, a calculated reference, a volume-related measurement, or another form of market information.
1. Weekly Reference Levels
Some weekly profile tools display reference levels associated with the current or previous trading week.
These levels can help you monitor how price behaves when approaching areas that may attract trader attention.
Look for questions such as:
- Is price approaching a previous weekly high or low?
- Has price moved decisively beyond a reference level?
- Is price repeatedly rejecting the same area?
- Is the market consolidating around a previously important level?
A reference level is not automatically support or resistance. The reaction of price helps determine whether the area is useful for your trading plan.
2. Weekly Price Ranges
The weekly range describes the distance between a week's high and low.
A developing range can help you assess whether price is moving directionally or remaining relatively contained.
For example, a market repeatedly trading within a narrow range may require a different approach from a market establishing successive higher highs and higher lows.
Do not assume that a narrow range must break out or that a wide range must reverse. Use the range as context, not as a prediction.
3. Profile Distribution And Concentration
If your chosen script displays a volume profile or another form of price distribution, learn how it calculates and presents that information.
In a volume-based profile, certain prices may show greater trading activity than others. Depending on the tool, traders may use these areas to investigate acceptance, rejection, consolidation, or potential reactions.
However, spot forex is a decentralized market. Volume displayed by a particular forex data feed may represent tick activity or another limited data source rather than the total volume traded across the global currency market.
Always understand the data behind the indicator before interpreting its levels.
4. Price Acceptance And Rejection
Price acceptance describes an environment in which the market continues trading around a particular area. Rejection describes a situation in which price moves away from an area after testing it.
Neither behavior should be judged by one candle alone.
Consider the speed of the move, candle closes, surrounding structure, and whether price continues to hold or break the area.
This is where candlestick analysis can improve your interpretation of weekly reference levels.
Learn more with our High Probability Japanese Candlestick Patterns educational resources to understand how candle formations can help you evaluate market behavior.
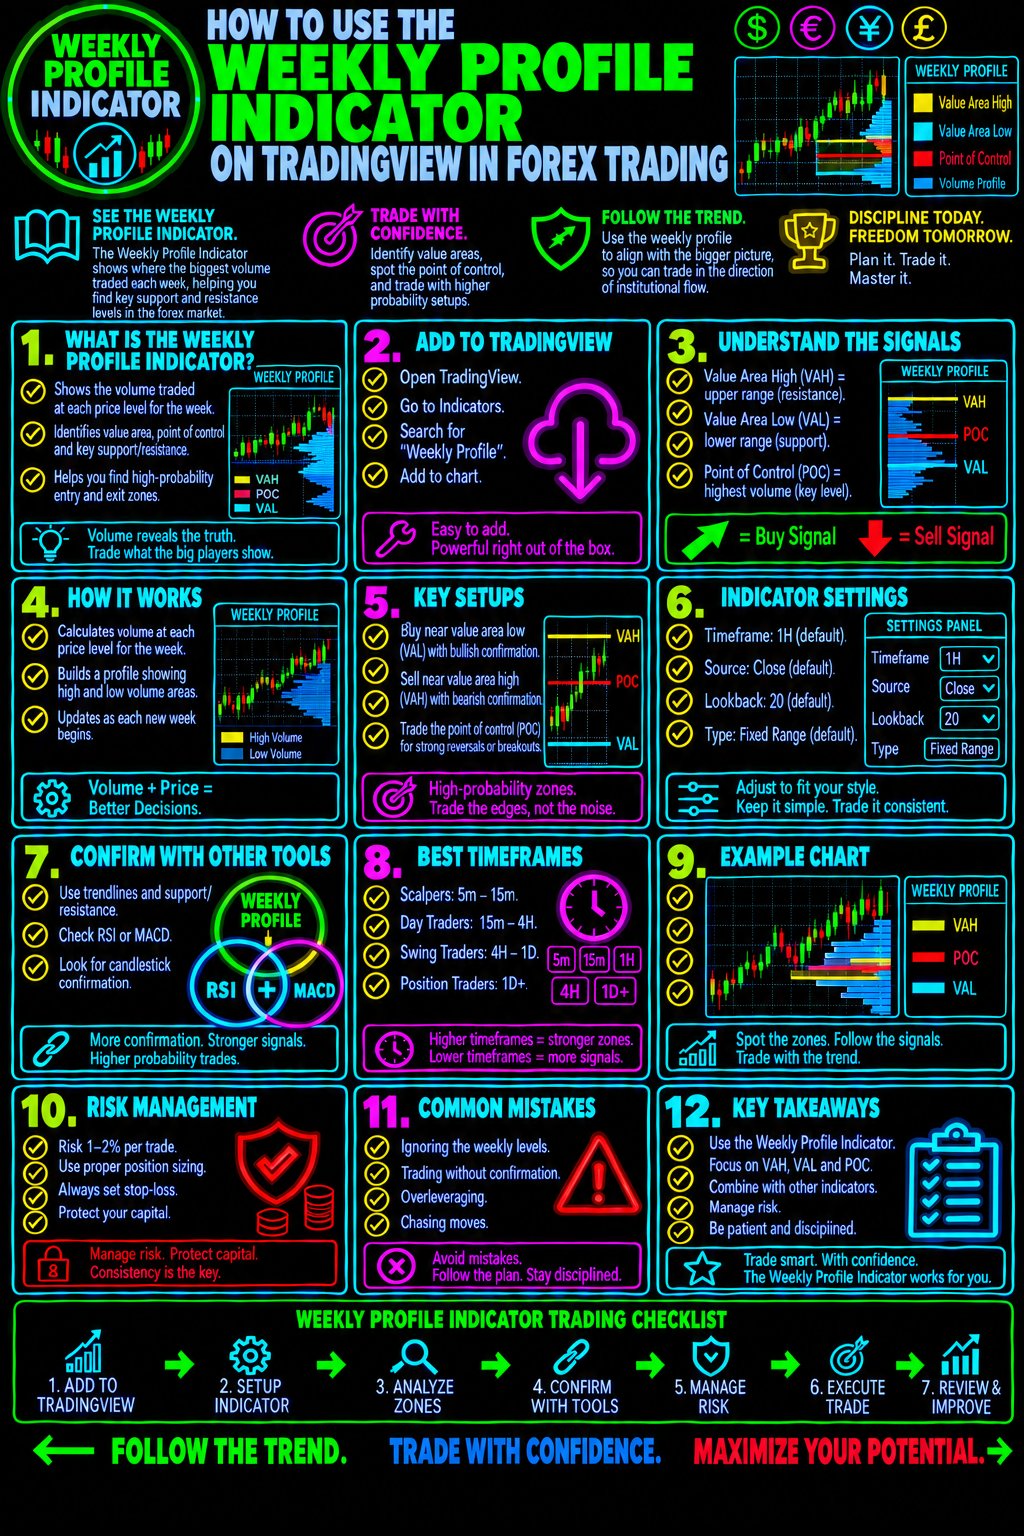
A Step-By-Step Weekly Profile Forex Trading Strategy
The following framework shows how you can incorporate weekly profile information into a structured trading plan.
It is an educational example, not a guaranteed or independently tested trading system.
Step 1: Establish The Higher-Timeframe Trend
Open the daily or four-hour chart and evaluate the market structure.
Ask whether price is establishing higher highs and higher lows, lower highs and lower lows, or moving sideways.
You can also examine major support and resistance levels, moving averages, or trend-analysis tools to help organize your observations.
Do not force a directional bias when the evidence is mixed.
Step 2: Identify The Relevant Weekly Levels
Review the Weekly Profile Indicator and identify the levels that are meaningful for your strategy.
Depending on the script, these might include weekly highs and lows, calculated reference areas, or volume-related profile levels.
Focus on a manageable number of areas instead of filling the chart with unnecessary lines.
Step 3: Wait For Price To Approach A Level
Allow price to come to your predefined area.
If price is far away from the level, there may be no immediate trade to take.
Patience is important because a structured trading strategy should define the conditions required for an entry rather than encourage trades simply because the market is moving.
Step 4: Look For Confirmation
When price reaches the area, inspect the lower timeframe for evidence that supports or contradicts your initial idea.
Possible confirmation tools include:
- A bullish or bearish candlestick pattern.
- A break of short-term market structure.
- A break-and-retest formation.
- Momentum confirmation.
- A clear rejection or acceptance of the level.
You do not need every signal to agree. Establish which conditions are mandatory for your strategy and test them consistently.
Explore our forex trading lessons on candlestick patterns, support and resistance, momentum indicators, and market structure to build a stronger understanding of these concepts.
Step 5: Define Your Entry And Stop-Loss
Before entering a trade, identify the price condition that would confirm your setup and the point at which your trading idea would be invalidated.
A stop-loss should reflect the setup's logic and account for normal market volatility. Avoid placing it at an arbitrary distance simply to increase the apparent reward-to-risk ratio.
Remember that spreads, slippage, and market gaps can affect the final execution price.
Step 6: Establish A Realistic Profit Target
Identify potential target areas using market structure, relevant reference levels, and the expected reward relative to the risk.
Do not assume that price must reach the next weekly level.
If the available reward does not justify the risk under your predefined rules, skipping the trade may be the better decision.
Step 7: Record And Review The Results
Document the setup, market conditions, entry, stop-loss, target, and outcome.
Over time, your records can help you determine whether weekly profile analysis adds value to your particular strategy.
Test the rules on historical charts and in a demo account before risking real money.
Example: Using The Weekly Profile With EURUSD
Suppose EURUSD is trending upward on the four-hour chart and approaching a reference area identified by your weekly profile tool.
Rather than entering immediately, you wait for price to reach the area.
Three possible scenarios may develop.
Scenario A: Bullish rejection
Price tests the area, forms a bullish rejection candle, and subsequently breaks a nearby short-term swing high.
If these conditions match your tested strategy, you can evaluate a potential long entry with a predefined invalidation point and profit target.
Scenario B: Decisive bearish breakdown
Price moves through the area with strong selling pressure and begins holding below it.
This weakens the immediate bullish case. Instead of automatically buying because price has reached a previously important level, you reassess the market structure.
Scenario C: Sideways consolidation
Price repeatedly crosses the area without establishing a clear direction.
The market may not offer a sufficiently clear setup. Waiting for a more decisive move can help you avoid forcing a trade.
These scenarios demonstrate an essential principle: the level identifies an area to investigate; price behavior helps determine whether a trade is justified.
Combine The Weekly Profile Indicator With Other Forex Trading Tools
The Weekly Profile Indicator can be more useful when it is part of a complete trading framework.
The key is to give each tool a specific job rather than stacking indicators that all attempt to measure the same thing.
Weekly Profile + Support And Resistance
Use established support and resistance areas to compare the weekly profile's reference levels with broader market structure.
When multiple independent forms of analysis point toward the same area, it may deserve closer attention. Confluence does not guarantee a successful trade.
Weekly Profile + Japanese Candlestick Patterns
Candlestick patterns can help you assess how buyers and sellers are behaving around a reference area.
Learn to recognize formations such as engulfing candles, pin bars, hammers, and shooting stars, while considering the surrounding trend and market structure.
Explore our High Probable Japanese Candlestick Patterns resources to strengthen your understanding of price-action analysis.
Weekly Profile + Moving Averages
Moving averages can help you evaluate the broader direction and smooth out some of the noise in price data.
A weekly reference area that coincides with a relevant moving average may warrant further examination, but avoid treating the overlap as an automatic buy or sell signal.
Weekly Profile + Momentum Indicators
Momentum tools can help you evaluate whether price movement appears to be strengthening or weakening.
For example, the MACD can provide information about momentum and trend conditions. It should be interpreted alongside price structure rather than used as a substitute for a complete trading plan.
Explore our MACD and forex momentum trading lessons to learn how these tools fit into a broader technical analysis process.
Weekly Profile + Risk Management
Risk management should remain central regardless of how many indicators appear to support a trade.
Determine your acceptable account risk, position size, stop-loss placement, and potential reward before entering.
For additional guidance, explore the Forex Trading Unlocked risk management resources and learn how to structure trades around predefined risk limits.
Common Mistakes To Avoid
Even a useful technical indicator can lead to poor decisions when it is misunderstood or applied without discipline.
Mistake 1: Treating Every Level As A Reversal Point
A price level does not force the market to reverse. Strong trends can continue through previously important areas.
Wait for the conditions required by your trading plan.
Mistake 2: Ignoring The Higher-Timeframe Trend
A potential reversal on a five-minute chart may be insignificant within a powerful daily trend.
Use the higher timeframe to understand the broader context before interpreting a short-term signal.
Mistake 3: Confusing Different Profile Calculations
Not all weekly profile scripts measure the same thing. A volume profile, a weekly range indicator, and a market-structure tool may produce different information.
Understand the selected script's calculations before relying on its output.
Mistake 4: Overloading The Chart
Too many indicators can create conflicting signals and make it harder to identify the conditions that actually matter.
Keep your chart focused on the tools that support your strategy.
Mistake 5: Changing Rules After Every Loss
No strategy wins every trade. Changing your settings after each losing position makes it difficult to determine whether the original rules have an advantage.
Maintain consistent records and evaluate results across a meaningful sample of trades.
Mistake 6: Neglecting Position Sizing
A technically strong setup can still produce an unacceptable loss if the position is too large.
Calculate position size from your account balance or equity, predetermined risk amount, stop-loss distance, and the currency pair's pip value.
Never risk money you cannot afford to lose.
Is The Weekly Profile Indicator Suitable For Beginners?
The Weekly Profile Indicator can be a useful learning tool for beginners who want to understand how weekly price behavior relates to shorter-term trading opportunities.
However, beginners should first develop a working knowledge of:
- Forex currency pairs and pip values.
- Bid and ask prices, spreads, and order execution.
- Market structure and trend identification.
- Support and resistance.
- Stop-loss placement and position sizing.
- The difference between a trading signal and a confirmed trading plan.
If you are new to forex, start with our foundational lessons before building a strategy around advanced indicators.
Start here: Explore the Forex Trading Unlocked forex trading education resources to develop your knowledge step by step.
How To Improve Your Forex Trading With A Structured Learning Plan
Learning one indicator is only the beginning. Consistent improvement comes from understanding how market structure, technical analysis, trading psychology, and risk management work together.
Forex Trading Unlocked is designed to help traders build that broader foundation.
Use the following learning path to continue developing your skills.
1. Build Your Forex Foundation
Understand how the currency market works, what drives exchange rates, and how to read forex charts.
2. Learn Price Action And Candlestick Analysis
Study how price behaves around important areas and how candlestick patterns can help you evaluate potential setups.
3. Develop A Repeatable Trading Strategy
Combine market structure, weekly reference levels, and a small number of complementary indicators into clearly defined rules.
4. Strengthen Your Risk Management
Learn how to calculate position size, establish stop-loss levels, assess reward relative to risk, and protect your trading capital.
5. Practice, Record, And Refine
Use historical analysis and demo trading to evaluate your rules before committing real capital.
The goal is to develop a repeatable process that you can evaluate objectively, rather than depend on isolated signals or predictions.
Take Your Forex Trading Education Further With Forex Trading Unlocked
You now understand how the Weekly Profile Indicator can fit into a broader forex trading strategy.
But identifying levels is only one part of the process. The next step is learning how to interpret price action, confirm potential setups, manage risk, and execute a consistent trading plan.
Forex Trading Unlocked provides educational resources to help you develop those skills.
Continue exploring our website to discover lessons on:
- High-probability Japanese candlestick patterns.
- Forex trading strategies and technical analysis.
- Support and resistance and market structure.
- MACD, momentum, and trend indicators.
- Forex risk management and trading psychology.
- TradingView indicators and charting techniques.
Whether you are building your first strategy or refining an established approach, keep learning and test every method against clear, measurable rules.
Get Started With Forex Trading Unlocked
Want to build a stronger foundation for your next trading decision?
Explore our forex education resources, study the tools that fit your trading style, and develop a structured approach to analyzing the currency markets.
Visit Forex Trading Unlocked to continue learning.
Educational disclaimer: This material is for informational and educational purposes only and does not constitute investment advice or a recommendation to buy or sell any financial instrument. Forex trading involves substantial risk, including the possible loss of your entire trading capital. Indicator performance and market conditions vary, and no indicator or strategy guarantees profits.
👉 “Get Instant Access (Check Your Email)”
💥 IMPORTANT: One Last Step Required
After you enter your email, check your inbox (or spam folder) for a confirmation email.
👉 Click the confirmation link so I can send you your free Forex training.
⚠️ If you don’t confirm, I can’t send you anything.
👉 “⚠️ Access expires if not confirmed within 24 hours minutes.”
👉 “Takes 10 seconds. Instant access after email confirmation.”