How To Use The Williams Alligator Indicator On TradingView In Forex Trading
The market doesn't always trend.
Sometimes price moves sideways. Sometimes it explodes into a trend. And sometimes what looks like a breakout quickly turns into a false move.
That is where the Williams Alligator Indicator can become a valuable tool for Forex traders.
The Williams Alligator was developed by legendary trader Bill Williams to help traders identify market trends and recognize periods when the market is essentially "sleeping" versus beginning to move.
When applied correctly on TradingView, the indicator can help you answer three important questions:
Is the market trending?
Which direction is the trend moving?
Is there enough momentum to consider a trade?
In this guide, you'll learn how to use the Williams Alligator Indicator on TradingView for Forex trading, how its three lines work, how traders interpret bullish and bearish conditions, and how to combine the indicator with price action and other technical analysis tools.
Important: The Williams Alligator should not be treated as a standalone buy or sell signal. It is a market-structure and trend-identification tool that becomes much more powerful when combined with confirmation and disciplined risk management.
What Is The Williams Alligator Indicator?
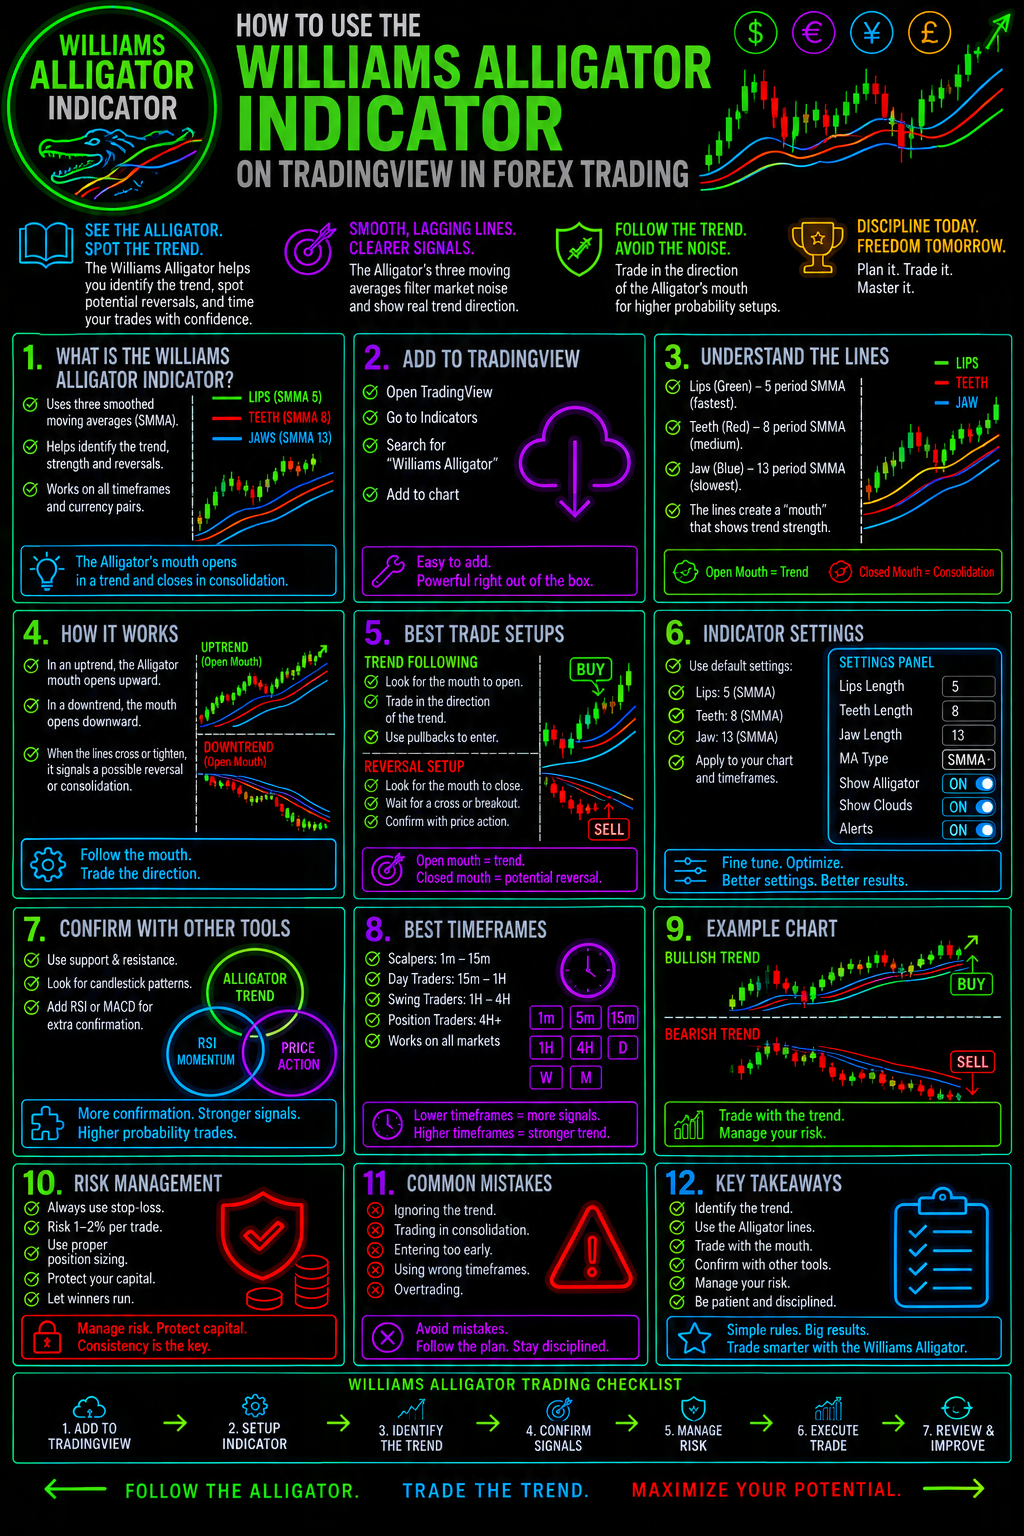
The Williams Alligator Indicator is a trend-following technical indicator designed to help traders identify the transition between ranging markets and trending markets.
It consists of three smoothed moving averages, commonly referred to as:
- Jaw
- Teeth
- Lips
These three lines interact with price and with one another.
When the lines are intertwined, the market may be experiencing consolidation or limited directional movement.
When the lines separate and begin moving directionally, the market may be developing a stronger trend.
This gives Forex traders a visual framework for identifying when the market is potentially transitioning from a quiet phase into a directional move.
The Three Lines Of The Williams Alligator
Understanding the three Alligator lines is essential before attempting to trade with the indicator.
1. The Alligator Jaw
The Jaw is the slowest of the three lines.
It is commonly calculated using a 13-period smoothed moving average with an 8-period forward shift.
The Jaw can be viewed as the longer-term component of the Alligator.
When price moves significantly away from the Jaw while the Alligator lines begin separating, traders may interpret this as evidence that directional movement is developing.
2. The Alligator Teeth
The Teeth is the intermediate line.
It is commonly calculated using an 8-period smoothed moving average with a 5-period forward shift.
The Teeth sits between the Jaw and Lips in terms of responsiveness.
It can help traders evaluate the developing direction of the market while filtering some of the shorter-term price fluctuations.
3. The Alligator Lips
The Lips is the fastest of the three lines.
It is commonly calculated using a 5-period smoothed moving average with a 3-period forward shift.
Because the Lips responds more quickly to price movement, it can provide an earlier indication that market conditions may be changing.
The relationship between the Lips, Teeth, and Jaw is one of the most important aspects of the Williams Alligator.
How To Add The Williams Alligator To TradingView
TradingView makes it simple to add the Williams Alligator to your Forex chart.Step 1: Open TradingView
Open your TradingView chart and select the Forex currency pair you want to analyze.
For example:
Step 2: Open Indicators
At the top of the TradingView chart, select Indicators.
Step 3: Search For Williams Alligator
Enter:
Williams Alligator
into the indicator search field.
Select the Williams Alligator indicator from the results.
Step 4: Apply It To Your Chart
The three Alligator lines will now appear on your chart.
You can adjust the indicator's settings and appearance to suit your trading methodology.
How To Read The Williams Alligator
The basic concept is straightforward.
The Alligator essentially moves through different market conditions.Sleeping Alligator
When the three lines become tangled or move close together, the market may be consolidating.
This is sometimes referred to as the Alligator being asleep.
Price may be moving sideways with relatively limited directional momentum.
For trend-following traders, this can be a warning that there may not yet be a strong directional opportunity.Waking Alligator
As the three lines begin separating, the market may be transitioning from consolidation into a directional move.
This is where traders begin watching for additional confirmation.Eating Alligator
When the lines are clearly separated and moving in a sustained direction, the market may be establishing a trend.
This is the environment where a trend-following strategy may have greater potential.Full Alligator
The objective isn't simply to see the lines separate.
The bigger question is whether price, momentum, market structure, and the Alligator are telling the same story.
That distinction can help prevent traders from entering simply because the lines crossed.
Williams Alligator Bullish Signal
A bullish Alligator setup generally occurs when the faster lines move above the slower lines and begin separating in an upward direction.
The general sequence traders watch for is:
Lips → Teeth → Jaw
with the faster component positioned above the slower components.
However, the position of the lines alone should not automatically trigger a Forex trade.
A stronger bullish setup may occur when:
- Price breaks above resistance.
- The Alligator begins opening upward.
- Market structure forms higher highs and higher lows.
- Momentum confirms the move.
- Price holds above important support.
- A pullback provides a potential entry opportunity.
This creates a confluence-based approach rather than relying on one indicator.
Williams Alligator Bearish Signal
A bearish setup is essentially the opposite.
Traders may look for the faster Alligator lines to move below the slower lines while the three lines begin separating downward.
A potentially stronger bearish environment may include:
- Price breaking below support.
- The Alligator opening downward.
- Lower highs and lower lows developing.
- Bearish momentum confirmation.
- Price remaining below resistance.
- A retracement creating a potential entry opportunity.
Again, the objective is confirmation—not simply reacting to a line crossing.
How To Trade The Williams Alligator On Forex
The Williams Alligator can be used in several different ways.
One of the most practical approaches is to use it as a trend filter.
Instead of asking:
"Should I buy or sell because the Alligator crossed?"
Ask:
"Is the Alligator confirming the market structure I am already seeing?"
That subtle change can dramatically improve how you use the indicator.
Williams Alligator Trend-Following Strategy
Here's a simple framework you can test and develop into your own trading system.Step 1: Identify The Market Direction
Start with a higher timeframe.
For example, if you trade the 15-minute chart, examine the 1-hour or 4-hour chart first.
Determine whether the larger market structure is:
- Bullish
- Bearish
- Sideways
Step 2: Apply The Williams Alligator
Look for the Alligator to support the direction identified through price structure.
Step 3: Wait For Separation
Avoid chasing the market when the three lines are tangled.
Instead, watch for the lines to begin separating.
Step 4: Wait For A Pullback
Rather than entering after a large impulsive move, wait for price to retrace toward an important technical area.
Step 5: Look For Confirmation
This is where additional technical tools can become extremely valuable.
Possible confirmation includes:
- Candlestick patterns
- Support and resistance
- Trendlines
- Fibonacci retracements
- Momentum indicators
- Breakouts
- Market structure
- Divergence
Step 6: Define Your Risk
Before entering the trade, determine:
Entry → Stop Loss → Position Size → Target
Never allow the indicator to determine your risk for you.
Williams Alligator + Support And Resistance
One of the strongest ways to improve an indicator-based strategy is through confluence.
For example, imagine EUR/USD is trending higher.
The Williams Alligator is opening upward.
Price then pulls back toward a previous resistance level that has become support.
A bullish candlestick pattern develops at that level.
Now several pieces of information are aligned:
Trend + Structure + Support + Price Action + Alligator
That is a much more compelling technical situation than simply seeing the Alligator lines cross.
Williams Alligator + Japanese Candlesticks
The Alligator can also be combined with Japanese candlestick analysis.
Look for price-action confirmation around important technical levels.
Potential bullish confirmations include:
- Bullish engulfing patterns
- Hammer formations
- Strong bullish rejection candles
- Morning star formations
Potential bearish confirmations include:
- Bearish engulfing patterns
- Shooting stars
- Strong bearish rejection candles
- Evening star formations
The Alligator helps identify the environment.
Candlestick analysis can help identify the trigger.
That combination can provide a more structured approach to trade execution.
Williams Alligator + Multiple Time Frame Analysis
Multiple Time Frame Analysis can make the Williams Alligator even more useful.
For example:Higher Timeframe
Use the 4-hour chart to determine the primary trend.Trading Timeframe
Use the 1-hour chart to identify the developing setup.Entry Timeframe
Use the 15-minute chart to look for the actual entry trigger.
This approach prevents traders from focusing entirely on a single chart.
The higher timeframe provides context.
The middle timeframe provides setup development.
The lower timeframe provides execution.
Williams Alligator For Forex Scalping
The Williams Alligator can also be used on lower timeframes.
However, traders should recognize an important problem:
Lower timeframes contain more market noise.
An Alligator signal on a 5-minute chart may be much less reliable than a properly confirmed setup on a higher timeframe.
If you're using the Alligator for scalping, consider combining it with:
- Key intraday support and resistance
- Market structure
- Session timing
- Volatility
- Price action
- Higher-timeframe direction
The goal is to reduce low-quality signals rather than increase the number of trades.
Williams Alligator For Forex Swing Trading
Swing traders may find the Williams Alligator particularly useful as a trend filter.
On higher timeframes, traders can monitor whether the market is developing a sustained directional trend.
A swing trader might look for:
Higher-timeframe trend → Alligator confirmation → Pullback → Price-action entry → Defined risk
This can help eliminate the temptation to trade every minor fluctuation.
Common Williams Alligator Trading Mistakes
The indicator itself is relatively simple.
Using it effectively is much harder.
Here are some of the biggest mistakes traders make.
Mistake #1: Trading Every Cross
Not every crossover represents a meaningful trend.
Markets frequently consolidate and produce false signals.
Mistake #2: Ignoring Market Structure
An indicator should not replace price analysis.
Always understand where price is relative to major support, resistance, highs, lows, and trend structure.
Mistake #3: Entering Too Late
When the Alligator lines have already separated dramatically and price has made a large move, chasing the market can create poor risk-to-reward conditions.
Mistake #4: Ignoring Higher Timeframes
A bullish setup on a 5-minute chart can occur directly against a powerful bearish 4-hour trend.
Higher-timeframe context matters.
Mistake #5: No Stop Loss
No indicator can eliminate uncertainty.
A proper risk-management plan should always be part of the strategy.
Best Timeframes For The Williams Alligator
There is no single "best" timeframe.
The appropriate timeframe depends on your trading style.
Trading Style Possible Timeframes
Scalping 1M–15M
Day Trading 15M–1H
Swing Trading 1H–4H
Position Trading 4H–Daily
The key is consistency.
Don't constantly switch timeframes simply because one chart produces a losing trade.
Which Forex Pairs Work Best With The Williams Alligator?
The Williams Alligator can be applied to virtually any liquid Forex pair.
However, liquidity and volatility can influence how the indicator behaves.
Major pairs such as:
can provide excellent markets for testing the indicator.
But remember:
The indicator does not make the market tradable.
Market conditions, liquidity, volatility, spreads, session timing, and risk management all matter.
Williams Alligator Trading Checklist
Before entering a trade, ask:
☐ What is the higher-timeframe trend?
☐ Is the market trending or ranging?
☐ Are the Alligator lines separating?
☐ Is price confirming the directional bias?
☐ Where are the nearest support and resistance levels?
☐ Is there a valid price-action setup?
☐ Is momentum supporting the trade?
☐ Where is my stop loss?
☐ What is my potential risk-to-reward ratio?
☐ What would invalidate the trade?
If you cannot answer these questions, the setup may not be ready.
Take Your Forex Trading Beyond A Single Indicator
The Williams Alligator can be an effective tool for identifying trends and filtering market conditions.
But successful Forex trading isn't about finding a magical indicator.
It's about building a repeatable trading process.
That process should bring together:
Market Structure + Trend + Confluence + Entry + Risk Management + Discipline
And that's where technical education becomes powerful.
If you want to develop a deeper understanding of Forex technical analysis, don't stop with the Williams Alligator.
Explore more of the Forex Trading Unlocked education and strategy resources to build a more complete trading framework.
Explore More Forex Trading Resources
Want to understand Forex market structure?
Learn how support, resistance, trends, breakouts, and price action work together to create potential trading opportunities.
Interested in Japanese Candlesticks?
Discover how high-probability candlestick formations can be incorporated into your Forex trading strategy.
Looking for more TradingView indicators?
Continue exploring our growing collection of How To Use TradingView Indicators In Forex Trading guides.
Want to improve your trading system?
Don't build your strategy around one indicator. Build a complete trading process.
Ready To Become A More Confident Forex Trader?
The Williams Alligator can help you see something many traders overlook:
The difference between a market that is moving and a market that is actually trending.
Learn to recognize that difference.
Learn to wait for confirmation.
Learn to manage risk.
And most importantly, develop a trading process you can execute consistently.Your next Forex trade shouldn't be based on a guess.
Build your knowledge. Build your strategy. Build your edge with Forex Trading Unlocked.
Explore Forex Trading Unlocked →
FAQ Section
What is the Williams Alligator Indicator?
The Williams Alligator is a technical analysis indicator developed by Bill Williams that uses three smoothed moving averages called the Jaw, Teeth, and Lips to help identify market trends and periods of consolidation.
How do you use the Williams Alligator on TradingView?
Search for Williams Alligator in TradingView's Indicators menu and add it to your Forex chart. Traders can then analyze the relationship between the Jaw, Teeth, and Lips to identify potential trending conditions.
Is the Williams Alligator good for Forex trading?
The Williams Alligator can be useful for Forex trend identification and market-condition analysis. It is generally more effective when combined with price action, market structure, support and resistance, and risk management.
What does it mean when the Williams Alligator lines cross?
A crossover can indicate a potential change in market conditions, but it should not automatically be treated as a buy or sell signal. Traders should seek additional confirmation.
What does it mean when the Williams Alligator lines are intertwined?
When the three lines are close together or intertwined, the market may be consolidating or experiencing limited directional movement.
Can you use the Williams Alligator for scalping?
Yes. The indicator can be applied to lower timeframes, but shorter charts generally contain more noise and false signals. Additional confirmation and disciplined risk management are especially important.
Can the Williams Alligator be used for swing trading?
Yes. Swing traders can use the Williams Alligator to help identify sustained trends and potentially filter trades according to the broader market direction.
What indicators work well with the Williams Alligator?
The Williams Alligator can be combined with support and resistance, Japanese candlesticks, trendlines, Fibonacci analysis, momentum indicators, and multiple timeframe analysis.
👉 “Get Instant Access (Check Your Email)”
💥 IMPORTANT: One Last Step Required
After you enter your email, check your inbox (or spam folder) for a confirmation email.
👉 Click the confirmation link so I can send you your free Forex training.
⚠️ If you don’t confirm, I can’t send you anything.
👉 “⚠️ Access expires if not confirmed within 24 hours minutes.”
👉 “Takes 10 seconds. Instant access after email confirmation.”