How To Use The Williams Variable A/D Pressure Indicator On TradingView In Forex Trading
The Forex market is constantly revealing clues about buying and selling pressure—but the challenge is knowing how to read them before the next major price move.
The Williams Variable A/D Pressure Indicator on TradingView gives Forex traders another way to study the relationship between price movement and underlying market pressure.
Instead of looking at price alone, traders can use pressure-based analysis to help identify whether buyers or sellers are gaining control, whether momentum is confirming a move, and whether a potential reversal deserves closer attention.
And when you combine this type of analysis with Forex trend analysis, support and resistance, candlestick patterns, divergence, and disciplined risk management, the chart can become much more informative.
This guide explains how to use the Williams Variable A/D Pressure Indicator on TradingView and how it can become part of a structured Forex trading strategy.
What Is The Williams Variable A/D Pressure Indicator?
The Williams Variable A/D Pressure Indicator is a TradingView technical analysis tool designed to help traders examine buying and selling pressure within the market.
A/D generally refers to Accumulation/Distribution, while the Williams-based approach adds another perspective to the way market pressure can be interpreted.
For Forex traders, the goal is not simply to watch whether EUR/USD, GBP/USD, USD/JPY, or another currency pair is rising or falling.
The bigger question is:
What is happening underneath the price movement?
A market can continue moving higher while underlying pressure begins to weaken.
A market can also decline while selling pressure starts losing strength.
Those situations can become important clues when combined with price action and other technical tools.
That is where the Williams Variable A/D Pressure Indicator can become useful.
Why Buying And Selling Pressure Matters In Forex
Price tells you where the market has been moving.
Pressure analysis can help you investigate how strongly buyers or sellers are participating in that movement.
Consider a Forex pair moving steadily higher.
At first glance, the trend appears bullish.
But what happens if the indicator begins showing weakening buying pressure?
That does not automatically mean the market will reverse.
Instead, it can tell you to pay closer attention.
The same concept applies during a downtrend.
If price continues falling but selling pressure begins to weaken, traders may want to watch for additional evidence that the existing trend is losing momentum.
This is one reason pressure indicators can become particularly useful when combined with:
- Forex trend analysis
- Support and resistance
- Japanese candlestick patterns
- Divergence
- Momentum indicators
- Breakout analysis
- Multi-timeframe analysis
- Risk management
The indicator should be treated as a confirmation tool, not a magic buy-or-sell button.
How To Find The Williams Variable A/D Pressure Indicator On TradingView
TradingView gives Forex traders access to a massive collection of technical indicators.
To locate the Williams Variable A/D Pressure Indicator:
- Open TradingView.
- Open a Forex chart.
- Select the Indicators menu.
- Search for Williams Variable A/D Pressure.
- Select the indicator.
- Add it to your chart.
- Adjust the settings if necessary.
Once added, the indicator can be analyzed alongside your price chart.
The objective is not to fill your screen with dozens of indicators.
The objective is to build a trading chart where every tool has a specific purpose.
How To Read The Williams Variable A/D Pressure Indicator
The first step is to understand the relationship between the indicator and price.
Rather than attempting to predict every market movement, look for confirmation, weakening pressure, and disagreement between price and the indicator.
Three areas deserve particular attention.1. Increasing Buying Pressure
When the indicator reflects strengthening bullish pressure while price is moving higher, the two pieces of information are working together.
Price is rising.
Pressure is supporting the move.
That can provide additional confirmation that buyers are participating in the current market direction.
However, confirmation is not the same thing as a guaranteed continuation.
Always consider the larger trend and nearby resistance levels.
2. Increasing Selling Pressure
The opposite situation occurs when price is moving lower while the indicator reflects strengthening bearish pressure.
Price is declining.
Selling pressure is supporting the move.
This can provide additional evidence that sellers remain active.
Again, traders should avoid treating one indicator reading as an automatic entry signal.
Look at the broader market structure.
3. Divergence Between Price And Pressure
This is where the indicator can become particularly interesting.
Divergence occurs when price and an indicator are not telling the same story.
For example:
Price makes a higher high.
The pressure indicator fails to make a corresponding higher high.
That may indicate that the strength behind the bullish move is weakening.
The opposite can occur during a bearish trend.
Price makes a lower low while the indicator fails to confirm the new low.
That may indicate weakening selling pressure.
Divergence does not guarantee a reversal.
Instead, it can create a warning signal that deserves additional confirmation.
This is where combining the Williams Variable A/D Pressure Indicator with candlestick patterns and key support or resistance levels can become powerful.
Williams Variable A/D Pressure Indicator And Forex Trend Trading
One of the simplest ways to use the indicator is as a trend-confirmation tool.
Start by identifying the primary market trend.
Ask:
Is the Forex pair trending higher, trending lower, or moving sideways?
Then examine the pressure indicator.Bullish Trend
Look for:Bearish Trend
- Higher highs
- Higher lows
- Bullish market structure
- Increasing or supportive buying pressure
- Pullbacks toward support
- Bullish price-action confirmation
Look for:
- Lower highs
- Lower lows
- Bearish market structure
- Increasing or supportive selling pressure
- Rallies toward resistance
- Bearish price-action confirmation
The objective is to avoid trading the indicator in isolation.
Instead, use it as one piece of a larger trading process.
Using The Williams Variable A/D Pressure Indicator With Support And Resistance
Support and resistance remain some of the most important concepts in technical Forex analysis.
A pressure indicator becomes much more useful when it is evaluated around important price levels.
Imagine EUR/USD approaching a major resistance zone.
Price pushes higher.
However, the Williams Variable A/D Pressure Indicator begins showing weakening pressure.
That combination may tell you to become more cautious about chasing the breakout.
Now consider the opposite.
EUR/USD reaches established support.
Price begins stabilizing while selling pressure weakens.
A bullish candlestick pattern then appears.
The three pieces of information are now working together:
Support + weakening selling pressure + bullish price action.
That does not guarantee a winning trade.
But it creates a much more structured trading setup than relying on an indicator alone.
Williams Variable A/D Pressure Indicator And Japanese Candlestick Patterns
Candlesticks show the battle between buyers and sellers directly through price.
The Williams Variable A/D Pressure Indicator can add another layer of information.
This creates an opportunity to combine:
Price Action + Pressure Analysis
For example, a trader may identify a bullish reversal candlestick pattern near support.
Instead of immediately entering the trade, the trader can examine the pressure indicator for additional confirmation.
The same process can be used with bearish reversal patterns near resistance.
This is especially useful for traders who already understand Japanese candlestick formations.
If you want to strengthen your candlestick knowledge, explore the High Probability Japanese Candlestick Patterns resources throughout Forex Trading Unlocked.
Using The Indicator To Identify Potential Reversals
Major Forex reversals rarely happen because of one indicator reading.
They often develop through a sequence of clues.
A market may:
- Reach an important support or resistance level.
- Begin losing momentum.
- Show divergence.
- Produce a reversal candlestick pattern.
- Break a short-term market structure level.
- Confirm the new direction.
The Williams Variable A/D Pressure Indicator can potentially contribute to that process by helping traders monitor changing pressure.
The key word is confirmation.
Do not enter a trade simply because pressure appears to be changing.
Wait for the market to provide additional evidence.
Williams Variable A/D Pressure Indicator For Breakout Trading
Breakouts are another area where pressure analysis can provide useful context.
When price breaks through a major resistance level, traders want to know whether the move has genuine participation behind it.
A breakout accompanied by supportive buying pressure can provide stronger confirmation than a breakout where pressure immediately begins weakening.
The same applies to bearish breakouts.
When price breaks below important support, traders can monitor whether selling pressure supports the move.
This can help distinguish between:
Potential breakout continuation
and
Potential false breakout conditions.
However, no indicator can eliminate false breakouts.
That is why risk management remains essential.
A Simple Williams Variable A/D Pressure Forex Strategy
Here is a straightforward framework you can test and refine.
Step 1: Identify The Trend
Begin on a higher timeframe.
Determine whether the currency pair is:
- Bullish
- Bearish
- Range-bound
Do not start with the indicator.
Start with market structure.
Step 2: Mark Important Levels
Identify:
- Support
- Resistance
- Previous highs
- Previous lows
- Breakout zones
- Major trendlines
These levels give your analysis context.
Step 3: Add The Williams Variable A/D Pressure Indicator
Now examine the pressure environment.
Ask:
Is pressure supporting the current trend or contradicting it?
Step 4: Look For Confirmation
Do not enter because the indicator changes direction.
Look for additional evidence such as:
- Candlestick confirmation
- Breakout confirmation
- Trend continuation
- Divergence
- Support/resistance reactions
- Multi-timeframe alignment
Step 5: Define Your Stop Loss
Before entering the trade, determine where the trade idea becomes invalid.
Your stop loss should be based on the structure of the setup—not an arbitrary distance.
Step 6: Define Your Profit Target
Determine where you expect price to encounter significant opposition.
Potential targets may include:
- Previous highs
- Previous lows
- Resistance
- Support
- Measured moves
- Risk-to-reward objectives
Step 7: Manage Your Risk
A good setup can still lose.
That is why risk management must be part of the strategy before the trade begins.
Learn more through the Forex Trading Unlocked Risk Management resources and build your trading process around controlled risk rather than oversized positions.
Williams Variable A/D Pressure Indicator With Multiple Timeframes
One of the biggest mistakes Forex traders make is analyzing only one timeframe.
A setup on a five-minute chart may look extremely attractive.
But what happens when the one-hour chart shows a major resistance level directly above it?
Context matters.
A multi-timeframe approach can help.Higher Timeframe
Identify the primary trend and major market structure.Intermediate Timeframe
Look for the developing setup.Lower Timeframe
Use price action and pressure confirmation for potential entry timing.
This approach can help prevent traders from becoming overly focused on short-term market noise.
Common Mistakes When Using The Williams Variable A/D Pressure Indicator
Mistake #1: Trading Every Indicator Signal
Not every change in pressure creates a trade.
The market is constantly moving.
Your job is to identify the conditions that fit your trading plan.
Mistake #2: Ignoring Price
The indicator is derived from market information.
Price remains the primary source of market structure.
Always know what price is doing.
Mistake #3: Ignoring Support And Resistance
A bullish pressure signal directly underneath major resistance may have a very different meaning than the same signal emerging from major support.
Context changes everything.
Mistake #4: Entering Too Early
A pressure shift can occur before price actually reverses.
That means traders can enter too early if they assume the indicator is predicting the future.
Look for confirmation.
Mistake #5: Using Too Many Indicators
Adding more indicators does not automatically create better analysis.
It can actually create conflicting signals and analysis paralysis.
Build a chart where each indicator has a defined job.
Mistake #6: Risking Too Much
No technical indicator can guarantee a winning trade.
The Williams Variable A/D Pressure Indicator should be used within a disciplined risk-management framework.
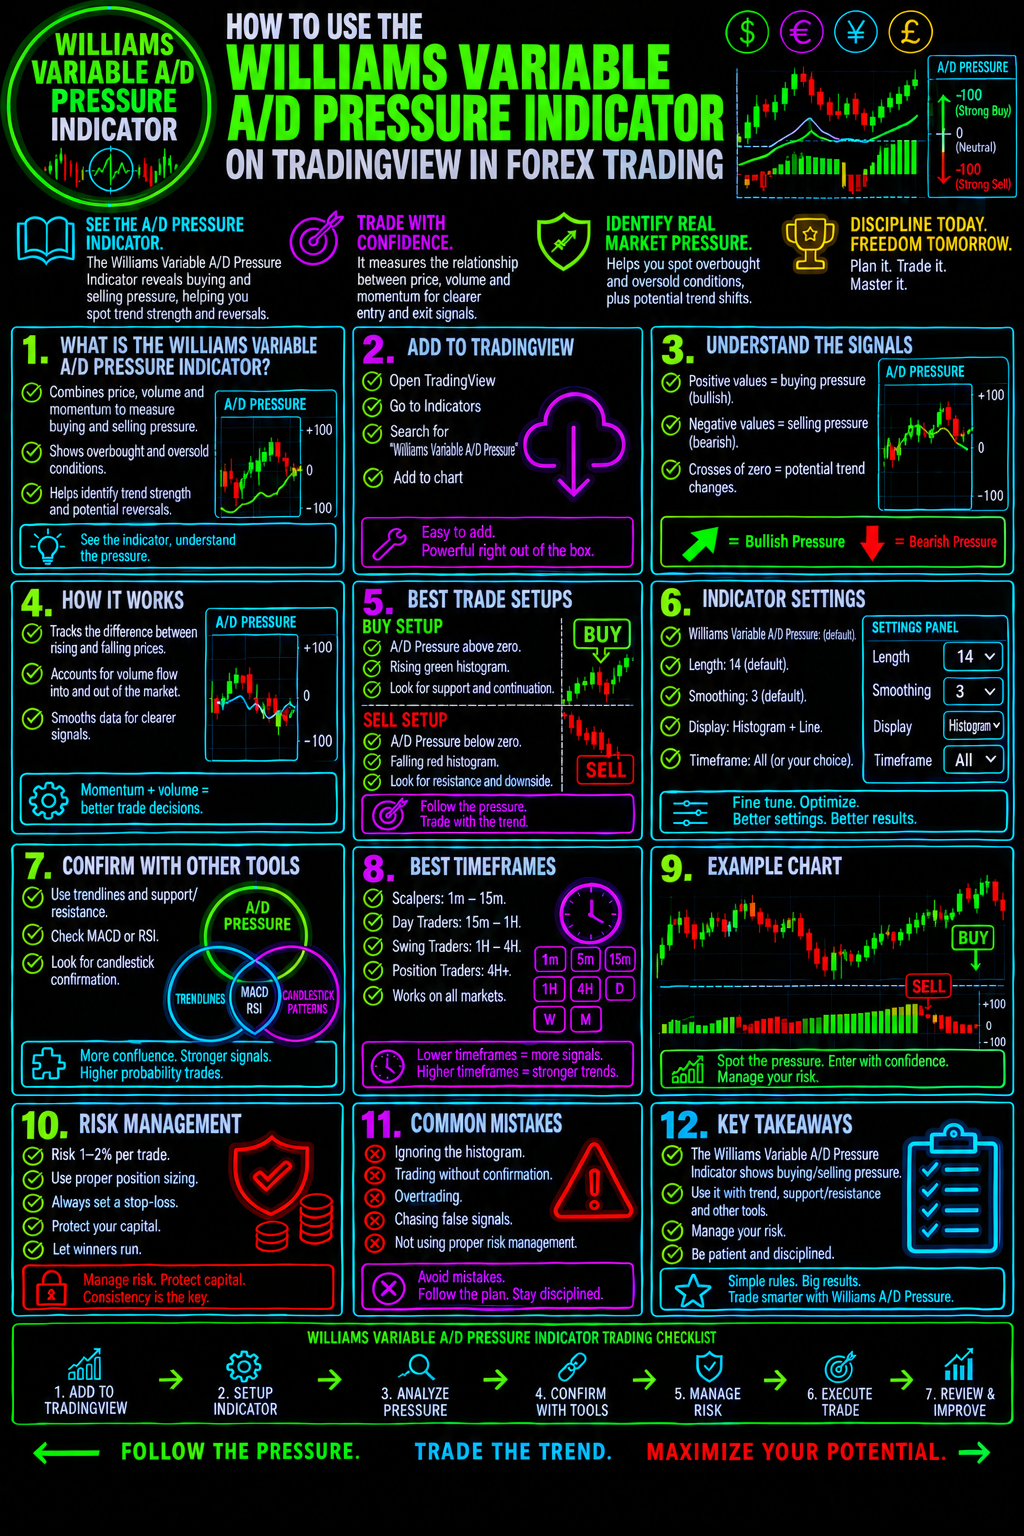
Williams Variable A/D Pressure Indicator vs. Other Forex Indicators
The Williams Variable A/D Pressure Indicator should not necessarily replace every other technical tool.
Instead, think about what information each tool provides.
Tool Primary Purpose
Williams Variable A/D Pressure Buying and selling pressure analysis
RSI Momentum and overbought/oversold analysis
MACD Momentum and trend analysis
Moving Averages Trend direction and dynamic levels
Support & Resistance Key price reaction zones
Japanese Candlesticks Price-action confirmation
Fibonacci Potential retracement and extension areas
The strongest trading framework is often not about finding one "perfect" indicator.
It is about combining complementary information without creating unnecessary complexity.
How To Build A TradingView Forex Chart Around The Indicator
A clean chart might include:
Price Chart
Support & Resistance
Williams Variable A/D Pressure
One Momentum Or Trend Tool
Clear Risk Management Rules
This gives every component a purpose.
The goal is not to predict every candle.
The goal is to identify high-probability trading conditions and manage risk when those conditions appear.
The Williams Variable A/D Pressure Indicator Is A Tool—Not A Trading System
This distinction is critical.
An indicator can provide information.
A trading system determines what you do with that information.
Your system should define:
- When you trade
- When you do not trade
- What confirms an entry
- Where the stop loss goes
- Where the profit target goes
- How much capital is at risk
- When you exit
- How you handle losing trades
- How you evaluate performance
That is what turns technical analysis into an actual trading process.
Take Your Forex Analysis Further
The Williams Variable A/D Pressure Indicator can provide another valuable perspective on the Forex market.
But the real opportunity comes from combining pressure analysis with a complete trading framework.
If you want to build stronger Forex skills, continue exploring Forex Trading Unlocked for practical education covering:
- Forex Trading Strategies
- Japanese Candlestick Patterns
- Support & Resistance
- Technical Indicators
- Divergence Trading
- Trend Trading
- Breakout Trading
- Scalping
- Swing Trading
- Risk Management
- Trading Psychology
- Multi-Timeframe Analysis
The more pieces of the market you understand, the better equipped you become to recognize high-quality trading opportunities.
Ready To Build A More Structured Forex Trading System?
Stop looking for the one indicator that will magically tell you when to buy or sell.
Instead, learn how to combine price action, market structure, pressure, confirmation, and risk management into a repeatable process.
The Williams Variable A/D Pressure Indicator can be one component of that process.
Your next step is to put the concepts together.
Explore the Forex Trading Unlocked courses, strategies, indicators, and trading resources to continue building your Forex trading knowledge.Start With The Free Forex Trading Starter Kit
Get the foundational concepts, trading principles, and risk-management ideas you need to begin building a more structured approach to the Forex market.
[GET THE FREE FOREX TRADING STARTER KIT]
Then continue deeper into the Forex Trading Unlocked education library and explore the strategies, candlestick patterns, indicators, and trading systems designed to help you become a more informed and disciplined Forex trader.
Final Thoughts
The Williams Variable A/D Pressure Indicator on TradingView gives Forex traders another way to examine the forces behind price movement.
Use it to study:
Buying pressure.
Selling pressure.
Trend confirmation.
Potential divergence.
Momentum changes.
Breakout conditions.
But always place those observations into the larger context of price action, market structure, support and resistance, and risk management.
The objective is not to predict every move.
The objective is to develop a repeatable process for identifying opportunities—and managing risk when you are wrong.
Trade the market you see. Follow your plan. Control your risk.
👉 “Get Instant Access (Check Your Email)”
💥 IMPORTANT: One Last Step Required
After you enter your email, check your inbox (or spam folder) for a confirmation email.
👉 Click the confirmation link so I can send you your free Forex training.
⚠️ If you don’t confirm, I can’t send you anything.
👉 “⚠️ Access expires if not confirmed within 24 hours minutes.”
👉 “Takes 10 seconds. Instant access after email confirmation.”