Hanging Man Japanese Candlestick Forex Trading Strategy
⚠️ The Hanging Man Pattern: A Warning Most Traders Miss
What if the market gave you a clear signal that a trend is about to reverse… before it actually happens?
That’s exactly what the Hanging Man candlestick pattern does.
Used correctly, this single candle can help you:
- Avoid buying at the top
- Spot high-probability reversals
- Enter trades with precision and confidence
But here’s the truth…
👉 Most traders either ignore it or trade it incorrectly.
This guide will change that.
📉 What Is the Hanging Man Candlestick Pattern?
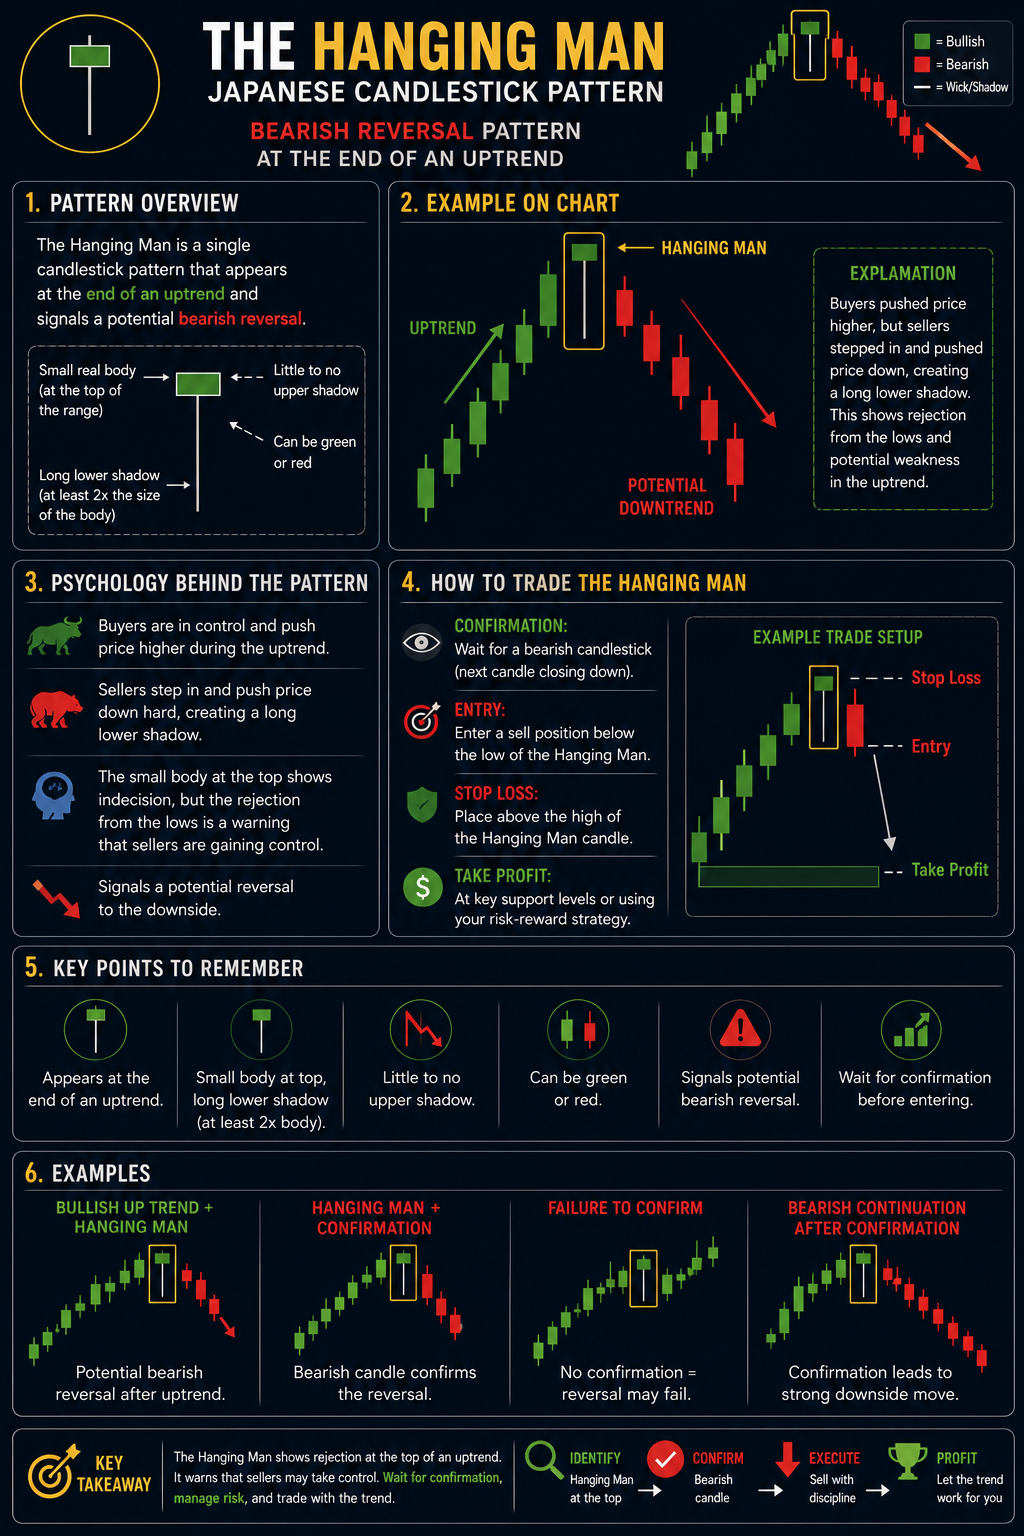
The Hanging Man is a bearish reversal pattern that appears after an uptrend.Key Characteristics:
- Small real body near the top of the candle
- Long lower wick (at least 2x the body)
- Little to no upper wick
- Appears at the top of an uptrend
It signals that:
👉 Sellers stepped in aggressively
👉 Buyers lost control
👉 A potential reversal is coming
🧠 The Psychology Behind the Pattern
Here’s what’s really happening behind the scenes:
- Buyers push price higher (continuing the uptrend)
- Suddenly, sellers step in and drive price sharply down
- Buyers manage to recover slightly before close
But the damage is done.
💥 That long lower wick reveals hidden selling pressure
Smart money is exiting… and the trend is vulnerable.
🎯 How to Trade the Hanging Man (Step-by-Step)
Step 1: Identify the Trend
Only trade the Hanging Man after a clear uptrend.
Step 2: Spot the Pattern
Look for:
- Small body
- Long lower shadow
- Position at market highs
Step 3: Wait for Confirmation (CRITICAL)
Never trade the candle alone.
✅ Confirm with:
- Bearish follow-up candle
- Resistance level
- RSI divergence
- Volume spike
Step 4: Entry Strategy
- Enter below the low of the Hanging Man candle
Step 5: Stop Loss
- Place stop above the candle high
Step 6: Take Profit
- Previous support levels
- Risk-to-reward minimum 1:2
🚫 Common Mistakes (Avoid These!)
❌ Trading without confirmation
❌ Using it in sideways markets
❌ Ignoring overall market structure
❌ Entering too early
Most traders lose because they rush the signal.
💡 Pro Tips for Maximum Accuracy
- Combine with support & resistance zones
- Use on higher timeframes (H1, H4, Daily)
- Pair with trend exhaustion indicators
- Watch for multiple rejection wicks
📊 Real Trade Example (Case Study)
Imagine EUR/USD in a strong uptrend…
A Hanging Man forms at resistance.
Next candle closes bearish.
👉 Entry triggers below the low
👉 Price drops 80+ pips
This is how professionals trade it.
🚀 Want More High-Probability Setups Like This?
If you’re serious about mastering candlestick trading…
You need a system.
📘 Get My Book:
High-Probable Japanese Candlestick Patterns
Inside you’ll discover:
- Entry + exit strategies
- Real chart examples
- Proven setups used by profitable traders
🎁 FREE Bonus: Download the Cheat Sheet
Get a printable PDF of the Hanging Man strategy:
- Pattern recognition guide
- Entry & exit checklist
- Pro tips
👉 [Download Free Cheat Sheet] - Coming Soon
🔗 Keep Learning
- Pin Bar Strategy
- Inside Bar Strategy
- Three Black Crows Strategy
- Three White Soldiers Strategy
- Top 10 Candlestick Patterns Every Trader Must Know
💬 Final Thought
The Hanging Man pattern is simple…
But when combined with the right confirmation and discipline, it becomes a powerful reversal weapon.
The question is:
👉 Will you ignore it like most traders…
👉 Or use it to gain an edge?
Your next trade could depend on it.
👉 “Get Instant Access (Check Your Email)”
💥 IMPORTANT: One Last Step Required
After you enter your email, check your inbox (or spam folder) for a confirmation email.
👉 Click the confirmation link so I can send you your free Forex training.
⚠️ If you don’t confirm, I can’t send you anything.
👉 “⚠️ Access expires if not confirmed within 24 hours minutes.”
👉 “Takes 10 seconds. Instant access after email confirmation.”