How to Use the Market Structure Coach Indicator on TradingView in Forex Trading
Learn to Read Market Structure, Identify Trend Changes, and Find Higher-Probability Forex Trading Opportunities
Successful forex trading starts with understanding what the market is doing—not guessing where price might go next.
The Market Structure Coach Indicator on TradingView can help traders study price behavior, recognize developing market structure, and evaluate potential trading opportunities using the relationship between swing highs, swing lows, trend direction, and possible structural changes.
When combined with sound technical analysis, disciplined risk management, and a clearly defined trading plan, market structure analysis can help you make more informed trading decisions.
At Forex Trading Unlocked, our goal is to help you develop the knowledge, tools, and strategies needed to approach the forex market with greater confidence and discipline.
Ready to improve your forex trading skills? Learn how to interpret market structure, combine technical indicators, and build a repeatable trading process.
Get Your Free Forex Trading Starter Kit
What Is the Market Structure Coach Indicator?
The Market Structure Coach Indicator is a TradingView charting tool designed to support the analysis of market structure.
Market structure refers to the way price develops over time through successive highs, lows, breakouts, pullbacks, and potential reversals. Traders use these movements to assess whether a currency pair is trending upward, trending downward, or moving sideways.
Depending on the indicator's specific implementation and settings, a market structure tool may help highlight important swing points, structural breaks, or possible changes in directional bias.
Before trading any signal, confirm what the particular version of the Market Structure Coach displays. Different scripts can use different calculations, labels, and confirmation rules.
Why Market Structure Matters in Forex Trading
Understanding market structure helps you answer five important questions:
- Is the currency pair trending higher or lower?
- Is price making higher highs and higher lows, or lower highs and lower lows?
- Has price broken an important swing level?
- Could the current trend be weakening or changing direction?
- Where might a logical entry, stop-loss, and profit target fit within the broader price structure?
Instead of entering trades simply because an indicator flashes a buy or sell signal, market structure analysis encourages you to evaluate the price action behind the opportunity.
Explore our related educational resource: Forex Trading Strategies.
How to Access the Market Structure Coach Indicator on TradingView
TradingView provides traders with charting tools, technical indicators, and customizable chart layouts for analyzing the forex market.
Follow these steps to locate and evaluate the Market Structure Coach Indicator.Step 1: Open TradingView
Visit TradingView and open a chart for the currency pair you want to analyze.
Choose a major forex pair such as EURUSD, GBPUSD, or USDJPY. Beginners may find it easier to study one currency pair consistently before expanding to additional markets.
Step 2: Search for the Indicator
Open the Indicators menu and search for Market Structure Coach.
If the indicator is publicly available, select the matching script from the search results. If it is private, restricted, renamed, or unavailable in the public library, you may need the author's specific access instructions.
Always verify the indicator's author and description before adding it to your chart.
Step 3: Add the Indicator to Your Chart
Select the appropriate indicator and examine how it presents market structure.
Pay attention to any available labels, lines, swing markers, directional signals, or other chart elements.
Do not assume that every version uses the same definitions. Review its published description and settings to understand exactly what each visual element represents.
Step 4: Configure the Settings
If the indicator offers adjustable settings, begin with the default configuration.
Change only one setting at a time so you can determine how it affects the signals or structural levels displayed on your chart.
Avoid optimizing settings solely to make historical signals look perfect. A configuration that appears effective in the past may perform poorly in live market conditions.
How to Read Forex Market Structure
1. Recognize Higher Highs and Higher Lows
An uptrend commonly develops through a sequence of higher highs and higher lows.
A higher high occurs when price rises above a previous swing high. A higher low occurs when a pullback holds above a previous swing low.
This pattern suggests that buyers are maintaining control of the broader price movement.
For example, suppose EUR/USD advances from 1.0800 to 1.0850, pulls back to 1.0820, and subsequently rises to 1.0880.
The market has formed a higher high and a higher low relative to the preceding swing structure.
Trading implication: Look for potential buying opportunities when price pulls back into a meaningful support area and bullish price action confirms that buyers may be returning.
However, an uptrend does not guarantee that the next move will be higher. Always define your risk before entering a trade.
2. Recognize Lower Highs and Lower Lows
A downtrend commonly forms lower highs and lower lows.
Price repeatedly fails to exceed previous swing highs while moving below previous swing lows.
This behavior suggests that sellers are exerting downward pressure.
For example, GBPUSD declines from 1.2800 to 1.2740, rebounds to 1.2770, and then falls to 1.2700.
The lower rebound high and subsequent lower low support a bearish market-structure interpretation.
Trading implication: Consider whether a rally toward resistance offers a potential selling opportunity, particularly when bearish price action supports the setup.
For additional technical analysis education, visit our Forex Trading Strategies resource.
3. Understand Break of Structure
A break of structure, often abbreviated BOS, describes price moving beyond a significant swing level in a way that may support continuation of the prevailing trend.
In a bullish market, a break above a relevant swing high may indicate that buyers are maintaining upward control.
In a bearish market, a break below a relevant swing low may indicate continued selling pressure.
The importance of a break depends on the swing level, the timeframe, the candle's closing behavior, and the surrounding market conditions.
A brief move beyond a level is not automatically a reliable trading signal. False breakouts can occur frequently, especially during low-liquidity periods or around major economic announcements.
4. Understand Change of Character
Some market-structure approaches use the term Change of Character, or CHoCH, to describe a potential early warning that the prevailing price behavior may be changing.
For example, a market that has been producing higher highs and higher lows may break below a meaningful higher low.
That break could suggest weakening bullish structure.
However, a potential structural change is not proof that a complete reversal has begun. Price may consolidate, recover, or resume its original direction.
The practical lesson: Treat a possible change in structure as a reason to reassess market conditions, not as an instruction to enter a trade automatically.
How to Use the Market Structure Coach Indicator to Find Forex Trade Setups
The most effective approach is to use market structure as a framework for evaluating trading opportunities rather than relying on a single signal.
Setup 1: Trade With the Established Trend
A trend-following setup seeks to enter in the direction of the prevailing market structure.
Bullish example:
- Identify a sequence of higher highs and higher lows.
- Wait for price to pull back toward a relevant support level or previous structural area.
- Look for bullish price-action confirmation.
- Determine whether the potential reward justifies the risk.
- Define your entry, stop-loss, and profit target before committing capital.
Bearish example:
- Identify a sequence of lower highs and lower lows.
- Wait for price to rally toward a relevant resistance level or previous structural area.
- Look for bearish price-action confirmation.
- Evaluate the available downside relative to the stop-loss distance.
- Plan the trade before entering.
This approach can help traders avoid taking positions that conflict with the prevailing directional bias.
Setup 2: Look for a Potential Trend Reversal
Reversal trading attempts to identify when the existing trend may be losing strength.
Suppose EUR/USD has been trending upward but subsequently breaks below a significant swing low.
Rather than immediately selling, evaluate whether price continues to form bearish structure, whether the break is sustained, and whether nearby support could limit the opportunity.
A more conservative trader may wait for a pullback and additional bearish confirmation.
The objective is not to predict every market turning point. It is to identify situations in which the available evidence supports a clearly defined trading plan.
Setup 3: Combine Market Structure With Support and Resistance
Support and resistance levels provide context for interpreting structural developments.
A bullish break above a significant resistance area may be more meaningful when price sustains the move and successfully retests the broken level.
Similarly, a bearish break below support may become more interesting if price subsequently fails to reclaim that level.
However, retests do not always occur, and a successful-looking breakout can still fail.
Learn more in our Support and Resistance Forex Trading Guide.
Setup 4: Use Multiple Timeframes
Multiple-timeframe analysis can help traders distinguish the broader market direction from shorter-term price fluctuations.
For example:
- Daily chart: Assess the broader trend and major structural levels.
- 4-hour chart: Identify intermediate swing points and potential trading zones.
- 1-hour chart: Evaluate possible entries and nearby invalidation levels.
A trader might use the daily chart to establish a bullish bias, the 4-hour chart to identify support, and the 1-hour chart to look for a potential entry trigger.
These timeframes are examples, not universal requirements. Select timeframes that suit your strategy and holding period.
For another way to evaluate trend alignment, explore our MTF Trend Dashboard Indicator Guide.
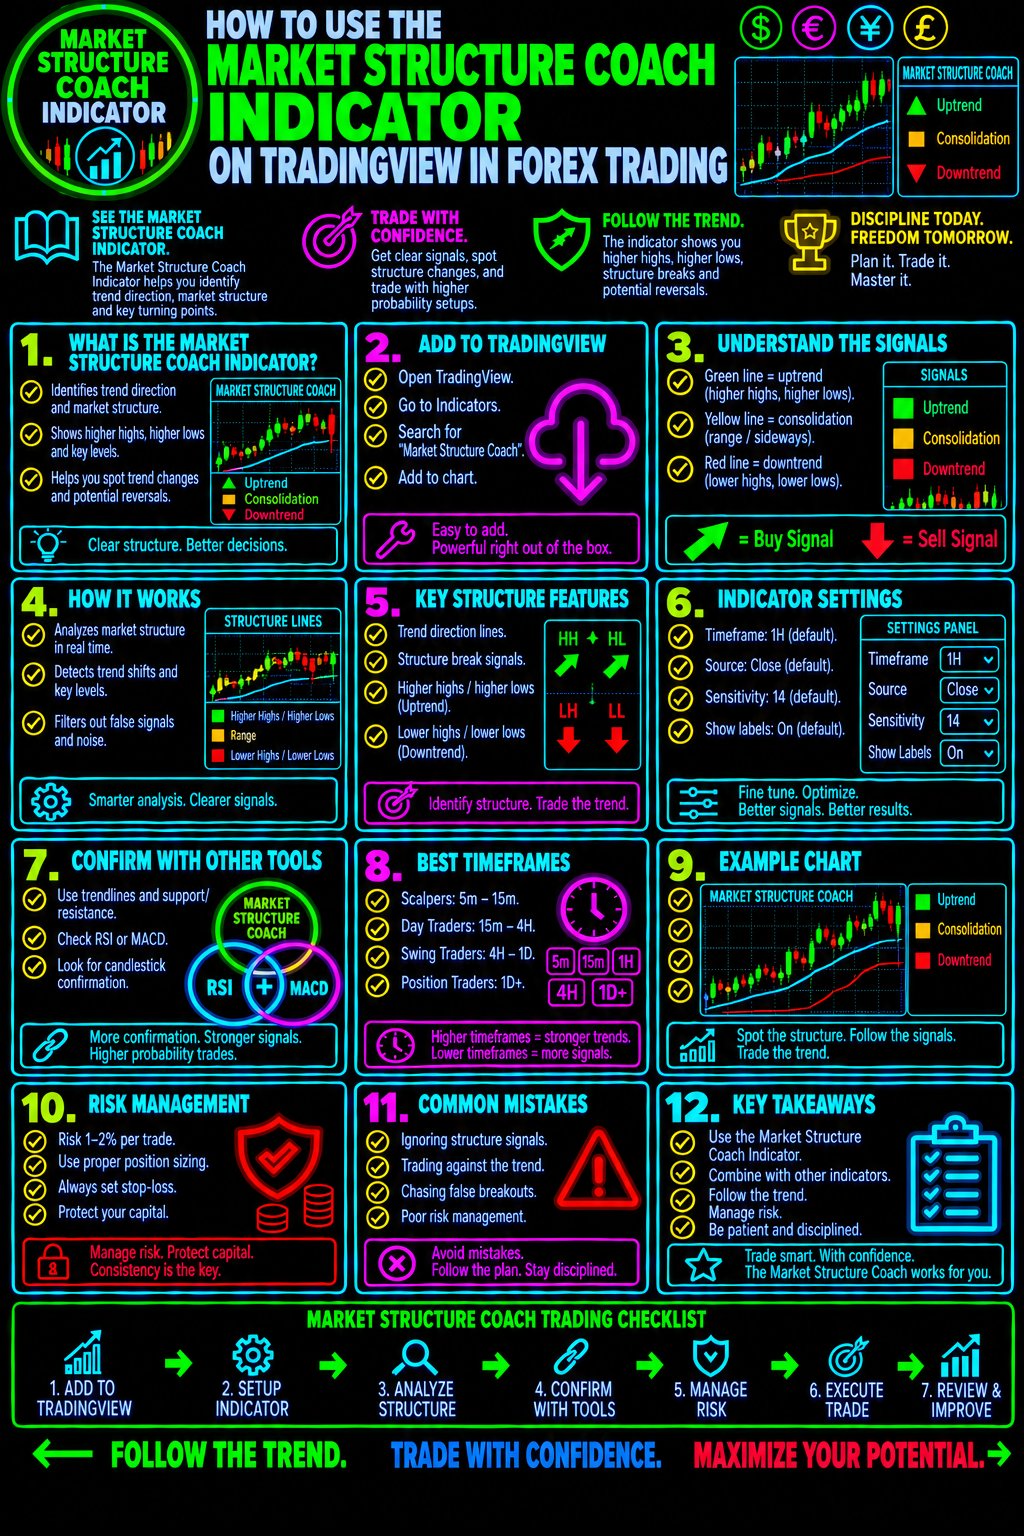
Combine Market Structure With Other Technical Indicators
Market structure becomes more useful when it is evaluated alongside independent evidence.
However, adding more indicators does not automatically improve trading results. Several indicators may simply measure the same underlying price movement.
Market Structure and RSI
The Relative Strength Index (RSI) measures the speed and magnitude of recent price changes.
RSI may help assess momentum when market structure suggests a possible continuation or reversal.
For example, if price is approaching a structural resistance level while momentum weakens, you may have a reason to examine the setup more closely.
Momentum divergence does not guarantee a reversal, and RSI can remain overbought or oversold during strong trends.
Read our RSI Forex Trading Guide to learn more.
Market Structure and MACD
The Moving Average Convergence Divergence (MACD) indicator helps traders evaluate momentum and potential changes in trend strength.
If market structure suggests an emerging bullish move and MACD momentum also improves, the two observations may support further investigation of a long setup.
The reverse may apply to a potential bearish setup.
Neither indicator guarantees the direction of the next price movement.
Continue your education with our MACD Forex Trading Guide.
Market Structure and Japanese Candlestick Patterns
Candlestick patterns can help traders examine how buyers and sellers respond at important price levels.
A bullish engulfing candle near a relevant support area may provide additional evidence for a potential long setup. A bearish rejection candle near resistance may support further investigation of a short setup.
The location of the pattern matters. A candlestick formation appearing in the middle of an unclear market structure may offer less useful context than one appearing at a meaningful structural level.
Learn how to interpret price action with our High-Probability Japanese Candlestick Patterns Guide.
How to Manage Risk When Trading Market Structure
Identifying a potentially attractive setup is only one part of successful trading. Risk management determines how much capital you expose when your analysis is wrong.
Define the Stop-Loss Before Entering
For a bullish setup, a stop-loss may be placed below a relevant structural low. For a bearish setup, it may be placed above a relevant structural high.
These are general examples, not mandatory rules. Your stop must account for the actual market structure, volatility, spread, and trade invalidation point.
A stop that is too tight may be triggered by ordinary price fluctuations. A stop that is too wide may create excessive risk relative to your account.
Calculate Position Size
A widely used educational guideline is to risk only a small percentage of trading capital on an individual trade. Some traders use 1% or less, although the appropriate amount depends on their circumstances and strategy.
For example, a hypothetical $10,000 account risking 1% would place $100 at risk on the trade before considering slippage, commissions, and other execution costs.
Position size should be calculated from the entry price, stop-loss distance, and the monetary value of the price movement.
Never increase your position simply because an indicator appears especially convincing.
Establish a Realistic Profit Target
Potential targets may include a previous swing high or low, a significant support or resistance area, or another level defined by your strategy.
Evaluate the potential reward relative to the amount at risk.
A trade can have a favorable-looking chart pattern and still be unattractive if nearby price obstacles leave insufficient room for the target.
For a deeper understanding of capital protection, explore our Forex Risk Management Guide.
Remember: No indicator eliminates losses. Forex trading involves substantial risk, and leverage can magnify both gains and losses.
Common Mistakes to Avoid When Using the Market Structure Coach Indicator
Even a useful charting tool can be misapplied. Avoid these common mistakes.
Mistake 1: Treating Every Structural Break as a Trade Signal
Not every break develops into a sustained trend. Evaluate the significance of the level and look for confirmation consistent with your trading plan.
Mistake 2: Ignoring the Higher-Timeframe Trend
A short-term bullish signal may occur within a much larger bearish trend.
Review the broader chart before deciding whether a setup fits your strategy.
Mistake 3: Entering Before a Candle Closes
Some indicators update while a candle is forming. Depending on how the script is coded, signals may change before the candle closes.
Understand whether the indicator confirms signals at candle close and whether its historical displays can change.
Mistake 4: Using Too Many Indicators
Stacking multiple indicators can create conflicting signals and unnecessary complexity.
Start with market structure, price action, and a clearly defined risk-management process. Add another tool only when it serves a specific analytical purpose.
Mistake 5: Ignoring Economic News
Central-bank decisions, inflation reports, employment figures, and other major economic releases can cause sharp price movements and wider spreads.
A technical setup may fail during these conditions, even when the underlying analysis appears reasonable.
Mistake 6: Failing to Test the Strategy
Before risking real capital, evaluate your approach using historical charts and a demo account.
Record entries, exits, stop-loss distances, outcomes, and market conditions. Include realistic trading costs and avoid relying solely on a handful of successful examples.
Build a Complete Forex Trading System
The Market Structure Coach Indicator can be one component of a broader trading methodology. To make that methodology repeatable, develop a process that connects market analysis, entry selection, risk management, and performance review.
Use this practical checklist before entering a trade:
- Identify the broader market direction.
- Mark relevant swing highs, swing lows, support, and resistance.
- Determine whether price structure supports continuation or suggests a possible change.
- Wait for a setup that meets your predefined entry criteria.
- Establish the stop-loss and calculate position size.
- Identify a realistic profit target.
- Check for major economic announcements and unfavorable trading conditions.
- Record the trade and review the result against your rules.
Consistency comes from applying a defined process, not from finding an indicator that never produces a losing trade.
Take Your Forex Trading Education Further
Forex Trading Unlocked provides educational resources designed to help traders develop their technical analysis, understand price behavior, and improve their trading discipline.
Continue building your skills with these resources:
- Forex Trading for Beginners — Develop a foundation in currency trading.
- Forex Trading Strategies — Explore different approaches to market analysis and trade selection.
- High-Probability Japanese Candlestick Patterns — Learn to evaluate candlestick formations in context.
- Forex Risk Management — Understand position sizing, stop-losses, and capital protection.
- MTF Trend Dashboard Indicator Guide — Explore multiple-timeframe trend analysis.
Get Your Free Forex Trading Starter Kit
You do not need dozens of indicators to begin building a more disciplined approach to forex trading. You need a solid foundation, a repeatable process, and a clear understanding of risk.
The Forex Trading Unlocked Starter Kit is a starting point for developing your trading knowledge and organizing your approach to the currency markets.
Get started today.
CLICK HERE TO GET YOUR FREE FOREX TRADING STARTER KIT
Learn the fundamentals. Improve your analysis. Build your trading plan.
Frequently Asked Questions About the Market Structure Coach Indicator
What does the Market Structure Coach Indicator do?
It is a TradingView charting tool intended to help traders analyze market structure. Its exact features depend on the particular script, so review the author's documentation to verify its labels, calculations, and signal rules.
Can beginners use the Market Structure Coach Indicator?
Yes, beginners can study it as part of their technical analysis education. They should first understand swing highs and lows, trend direction, support and resistance, and basic risk management.
Does the Market Structure Coach Indicator predict forex market reversals?
No indicator can reliably predict every reversal. Market-structure changes can provide evidence that price behavior is shifting, but false breaks and failed reversals are common.
Which timeframe should I use?
The appropriate timeframe depends on your trading style. Swing traders may examine the daily and 4-hour charts, while shorter-term traders may use lower timeframes. Testing is essential before selecting a configuration.
Can I combine market structure with RSI and MACD?
Yes. These tools can provide additional information about momentum and trend conditions. However, they should complement—not replace—price analysis and a clearly defined trading plan.
Is the Market Structure Coach Indicator profitable?
No indicator guarantees profitability. Results depend on the trading rules, market conditions, execution, costs, and risk management. Test the complete strategy before using real money.
Final Thoughts: Trade the Structure, Not the Guess
The Market Structure Coach Indicator can help organize your analysis of forex price movements, but the real value comes from understanding the structure behind the chart.
Learn to recognize trends, evaluate important swing levels, distinguish potential continuation from possible reversal, and plan every trade around a defined level of risk.
Combine that knowledge with disciplined execution and continuous review to develop a more structured approach to forex trading.
Forex Trading Unlocked is here to help you take the next step.
Get Your Free Forex Trading Starter Kit
Risk Disclosure: Forex trading involves significant risk and may not be suitable for every investor. Leverage can magnify losses. Technical indicators provide analytical information, not guarantees of future results. Always conduct your own research and use risk-management practices appropriate to your circumstances.
👉 “Get Instant Access (Check Your Email)”
💥 IMPORTANT: One Last Step Required
After you enter your email, check your inbox (or spam folder) for a confirmation email.
👉 Click the confirmation link so I can send you your free Forex training.
⚠️ If you don’t confirm, I can’t send you anything.
👉 “⚠️ Access expires if not confirmed within 24 hours minutes.”
👉 “Takes 10 seconds. Instant access after email confirmation.”