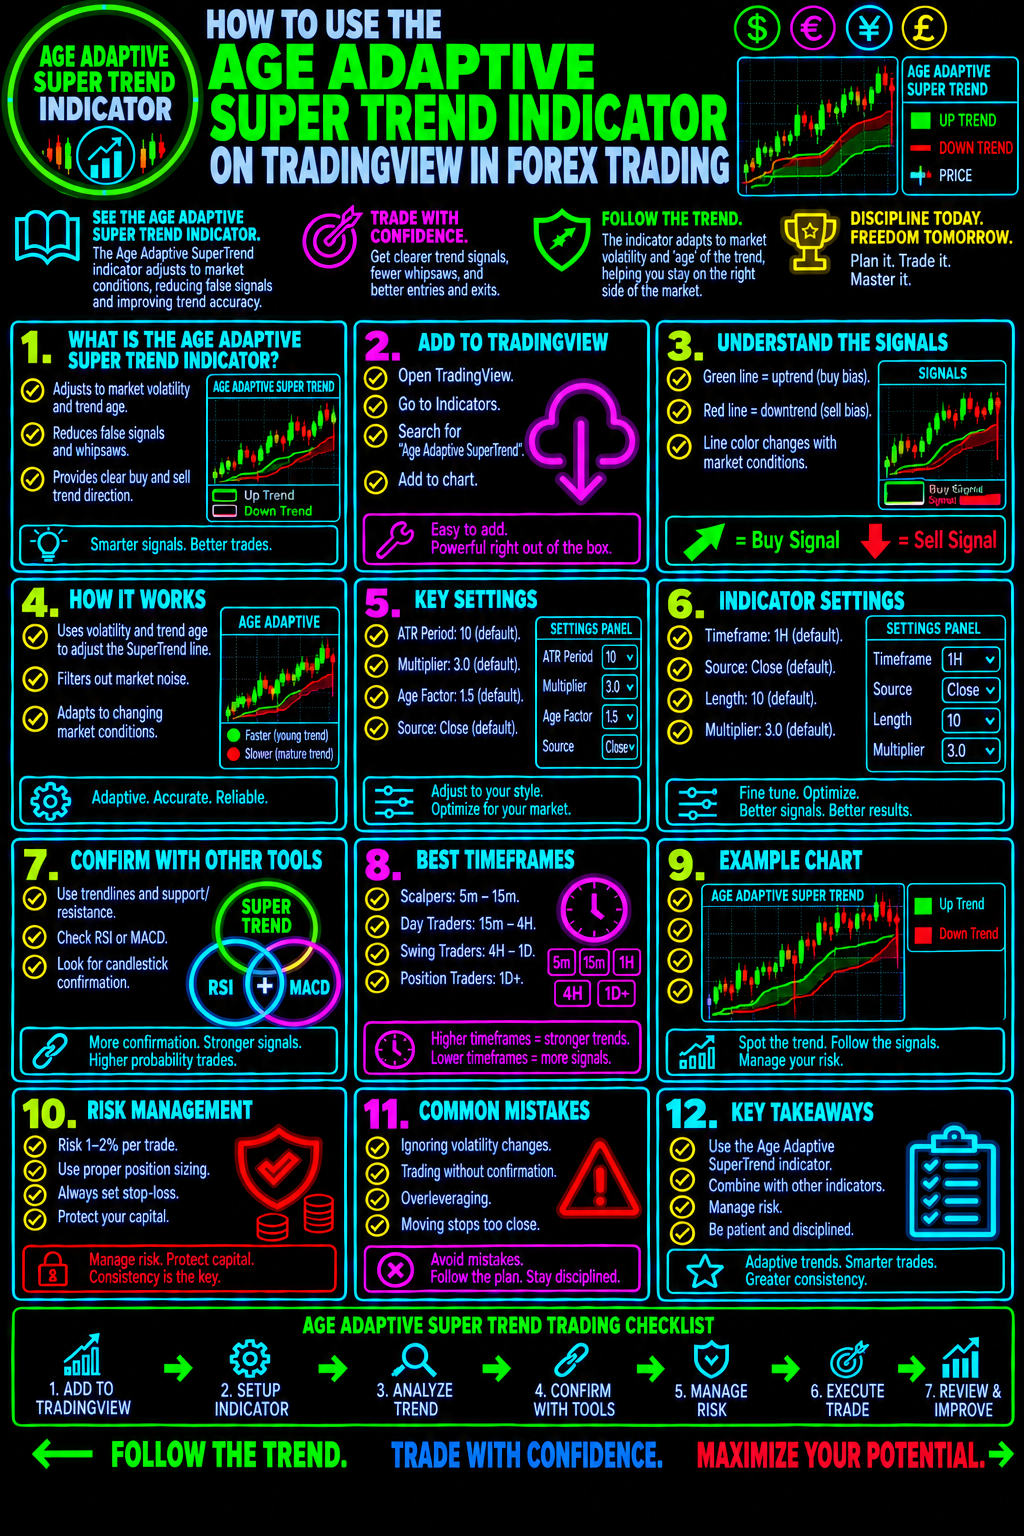
How to Use the Age Adaptive SuperTrend Indicator on TradingView in Forex Trading
Learn to Identify Forex Trends, Spot Potential Reversals, and Improve Your Trade Timing
Successful forex trading requires more than recognizing whether a currency pair is moving up or down. Traders need a structured method for identifying trends, evaluating momentum, managing risk, and deciding when a trade setup deserves attention.
The Age Adaptive SuperTrend Indicator on TradingView is a technical analysis tool worth exploring if you want to study trend direction and potential changes in market behavior. Its age-adaptive approach suggests an emphasis on incorporating the age or duration of a trend into trend analysis. The exact calculation and signals depend on the indicator's specific implementation and settings.
In this guide, you will learn how to approach the Age Adaptive SuperTrend Indicator, how to incorporate it into a forex trading strategy, and how to combine trend analysis with confirmation and disciplined risk management.
Your goal is simple: Build a repeatable trading process instead of chasing every market move.
What Is the Age Adaptive SuperTrend Indicator?
The Age Adaptive SuperTrend Indicator is a TradingView indicator designed around SuperTrend-style trend analysis, with an additional age-adaptive component.
Traditional SuperTrend indicators generally use price volatility, commonly calculated with the Average True Range (ATR), to establish a trend-following line. Depending on the implementation, price moving across that line may indicate a potential change in trend direction.
An age-adaptive variation may incorporate information about how long a trend has persisted into its calculations or interpretation. However, traders should verify the specific script's formula, settings, and documentation rather than assume every Age Adaptive SuperTrend version works identically.
When evaluating this indicator, focus on three questions:
- Trend direction: Does the indicator suggest bullish or bearish market conditions?
- Trend development: Is the market continuing in an established direction, or is price behavior changing?
- Trade confirmation: Does price action support the potential setup, or is the signal occurring in a choppy market?
Remember that no trend indicator can predict future price movements with certainty. The indicator should support your analysis, not replace it.
Why Forex Traders Should Study Trend-Adaptive Indicators
Forex markets regularly transition between trending, consolidating, and volatile conditions. A strategy that performs well during a sustained trend may struggle when price repeatedly reverses within a narrow range.
Trend-adaptive indicators are useful to investigate because they may help traders organize their interpretation of changing market conditions.
1. Recognize Potential Bullish Trends
When the indicator shows bullish conditions, examine whether price is forming higher highs and higher lows.
A bullish trend-following opportunity becomes more interesting when price structure, momentum, and the indicator point in the same direction.
2. Recognize Potential Bearish Trends
When the indicator shows bearish conditions, look for lower highs, lower lows, and continued selling pressure.
A bearish signal alone is not sufficient. Check whether the broader market structure supports a possible short trade.
3. Evaluate Potential Trend Changes
A change in the indicator's direction may draw attention to a possible transition between bullish and bearish conditions.
However, a change in direction does not guarantee a reversal. It can also occur during a temporary pullback, a volatile session, or a sideways market.
4. Establish a More Consistent Trading Process
The indicator can become one component of a rules-based trading plan. By defining your entry requirements, invalidation level, and risk before entering a trade, you can reduce impulsive decisions.
For a deeper understanding of the principles behind trading discipline, explore our forex education resources and risk management lessons throughout Forex Trading Unlocked.
How to Add the Age Adaptive SuperTrend Indicator to TradingView
TradingView provides charting tools that allow traders to analyze currency pairs, evaluate technical indicators, and develop trading strategies.
Follow these steps to locate and evaluate the indicator.
Step 1: Open TradingView
Visit TradingView and open a chart for the forex pair you want to analyze.
Step 2: Select Your Currency Pair
Start with a liquid pair such as EURUSD, GBPUSD, or USDJPY. Choose a pair you understand and can monitor consistently.
Step 3: Open the Indicators Menu
Select the Indicators button above the chart.
Step 4: Search for the Indicator
Search for “Age Adaptive SuperTrend.” If several scripts appear, verify the exact name, author, description, and calculation method before selecting one.
If the indicator is not available in the public library, confirm whether the version you intend to use requires a direct script link, private access, or another installation method.
Step 5: Add the Indicator to Your Chart
Select the correct script and allow it to load. Review the displayed trend line, colors, markers, and other visual elements.
Do not assume that a particular color represents a buy or sell signal until you have confirmed the script's legend or documentation.
Step 6: Review the Settings
Examine any available inputs, including trend sensitivity, volatility parameters, smoothing settings, or age-related controls. These options vary by implementation.
Avoid changing multiple settings simply to make historical signals look better. Test any adjustments on unseen market data before relying on them.
How to Interpret the Age Adaptive SuperTrend Indicator
Once the indicator is displayed, the next step is learning how to evaluate its information in the context of price action.
Bullish Conditions
A potential bullish setup deserves further investigation when:
- The indicator indicates an upward trend.
- Price structure supports higher highs and higher lows.
- Price holds above a relevant support level or recovers from a controlled pullback.
- Momentum supports the potential continuation.
- The trade offers a reasonable reward relative to the risk.
These conditions do not guarantee a winning trade. They establish a framework for deciding whether a setup deserves consideration.
Bearish Conditions
A potential bearish setup deserves further investigation when:
- The indicator indicates a downward trend.
- Price structure supports lower highs and lower lows.
- Price fails to reclaim a relevant resistance level.
- Selling pressure supports the potential continuation.
- The planned entry offers an acceptable risk-to-reward profile.
The strongest process is one in which the indicator and price action provide complementary information rather than duplicate signals that are treated as independent proof.
Sideways or Uncertain Conditions
Be particularly cautious when price repeatedly crosses the trend line or when the market lacks a clear directional structure.
Repeated changes in direction can produce conflicting signals and unnecessary transaction costs.
Sometimes the best trading decision is to wait.
A Practical Age Adaptive SuperTrend Forex Trading Strategy
The following framework provides a starting point for developing and testing a trend-following strategy. It is not a verified strategy specific to every Age Adaptive SuperTrend script.
Step 1: Establish the Higher-Timeframe Direction
Begin with a higher timeframe to determine whether the market is trending upward, trending downward, or moving sideways.
For example, a trader considering entries on the one-hour chart might first examine the four-hour chart for broader market structure.
The higher timeframe provides context; it does not eliminate the possibility of a losing trade.
Step 2: Identify a Potential Setup
Use the Age Adaptive SuperTrend Indicator to help evaluate whether the current trend direction supports the trade you are considering.
Avoid entering simply because the indicator changes color or displays a marker. First determine whether the signal fits your trading rules.
Step 3: Look for Price-Action Confirmation
Potential confirmation factors include:
- A break and retest of a meaningful support or resistance level.
- A bullish or bearish candlestick formation.
- A pullback followed by renewed directional movement.
- A momentum reading that agrees with the proposed trade.
For additional study, explore our High-Probability Japanese Candlestick Patterns resource to learn how candlestick structure can help you interpret price behavior.
Step 4: Define Your Entry
Choose a specific entry rule before placing an order. For example, your plan might require a confirmed break of a recent swing level after the indicator establishes a directional bias.
Specify whether the entry requires a candle close, a retest, or another objective condition.
A rule that can be tested consistently is more useful than a signal interpreted differently on every trade.
Step 5: Set Your Stop-Loss
Determine where the trade idea would be invalidated. A recent swing high or low may provide a structural reference, although the appropriate location depends on volatility and the setup.
Do not place a stop-loss solely at an indicator line without evaluating the market structure and the possibility of normal price fluctuations.
Step 6: Calculate Your Position Size
Before entering, calculate the amount you could lose if the stop-loss is reached.
A useful educational guideline is to risk only a small, predefined percentage of trading capital on an individual trade. Some traders use 1% or less, depending on their circumstances and strategy.
Position sizing should reflect the distance to the stop-loss, account equity, and the instrument's pip value.
Step 7: Establish Your Exit Rules
Define your profit-taking and trade-management rules before entry.
Possible approaches include:
- Targeting a predetermined reward-to-risk ratio.
- Using a relevant support or resistance level.
- Managing the position according to a tested trailing-stop rule.
- Exiting when predefined trend-invalidation conditions occur.
Do not assume that an indicator reversal automatically provides the best exit. Test your chosen exit method against the same entry rules.
Combine the Indicator With Other Technical Analysis Tools
The Age Adaptive SuperTrend Indicator should be evaluated as part of a broader decision-making process.
Support and Resistance
Support and resistance analysis helps identify price areas where buying or selling pressure may emerge. A trend-following signal near a meaningful level can provide a different context from the same signal in the middle of an established trading range.
Japanese Candlestick Patterns
Candlestick formations can help traders examine rejection, indecision, and changes in buying or selling pressure.
Use them to confirm a defined setup rather than treating every recognizable candle as an automatic entry signal.
RSI and Momentum Analysis
Momentum tools such as the Relative Strength Index (RSI) can help assess the strength of recent price movement.
However, momentum indicators can remain overbought or oversold during strong trends. Interpret them in context rather than using fixed thresholds as guaranteed reversal signals.
Multi-Timeframe Trend Analysis
Higher-timeframe analysis can help you avoid taking a short-term trade that conflicts with the broader price structure.
Explore our MTF Trend Dashboard Indicator TradingView Guide to learn more about evaluating trend conditions across multiple timeframes.
Divergence Analysis
Momentum divergence may draw attention to a possible weakening of directional pressure. It is not proof that a reversal will occur.
Our Divergence Scanner Indicator TradingView Guide provides another avenue for studying divergence as part of a structured technical analysis process.
Which Forex Timeframe Should You Use?
There is no universally best timeframe for the Age Adaptive SuperTrend Indicator. Your choice should reflect your trading style, available time, transaction costs, and tested results.
Scalping: Shorter timeframes produce more frequent signals but can also contain more market noise and greater sensitivity to spreads and execution costs.
Day trading: Intraday charts may offer a balance between identifying setups and managing positions within a trading session.
Swing trading: Higher timeframes can help traders focus on larger market movements while accepting that positions may remain open overnight.
Whichever timeframe you choose, use the same documented rules when evaluating performance. Do not select a timeframe solely because it displays the most attractive historical signals.
Common Mistakes to Avoid
Even a useful indicator can become ineffective when applied without a disciplined process.
Mistake 1: Treating every signal as a trade. A signal is an invitation to investigate a setup, not an obligation to enter the market.
Mistake 2: Ignoring the broader trend. A short-term change in direction may occur within a larger trend. Examine the full price structure before making a decision.
Mistake 3: Over-optimizing indicator settings. Excessive adjustments can make historical results look better without improving future performance.
Mistake 4: Trading without a stop-loss plan. Determine the trade's invalidation point and position size before entering.
Mistake 5: Confusing a backtest with proof of future profitability. Historical results may not reflect future volatility, spreads, slippage, or changing market conditions.
Mistake 6: Using too many indicators. Adding tools does not necessarily improve decision-making. Each indicator should serve a clear purpose within your strategy.
How to Test the Age Adaptive SuperTrend Strategy
Before risking real money, evaluate the exact indicator version and trading rules you intend to use.
- Choose a specific currency pair and timeframe.
- Document your entry, stop-loss, exit, and position-sizing rules.
- Test the rules across different market conditions.
- Include realistic spreads, commissions, and slippage where applicable.
- Track win rate, average win, average loss, maximum drawdown, and expectancy.
- Reserve a separate period of historical data for out-of-sample testing.
- Forward-test the strategy in a demo account before considering live trading.
Pay attention to expectancy, not just win rate. A strategy can win frequently and still lose money if its average loss is too large relative to its average win.
Also verify whether the indicator repaints, recalculates historical signals, or uses information that was unavailable at the time of the original signal. These characteristics can materially affect backtest results.
The objective is not to find a perfect indicator. It is to determine whether the indicator contributes measurable value to a complete trading process.
Frequently Asked Questions
What Does the Age Adaptive SuperTrend Indicator Do?
It is a SuperTrend-style technical analysis tool with an age-adaptive concept. Its intended use is to help traders evaluate trend direction and potential changes in market behavior. The exact mechanics depend on the specific script.
Is the Age Adaptive SuperTrend Indicator Good for Forex Trading?
It may be useful as part of a structured trend-following approach. Its effectiveness depends on the implementation, currency pair, timeframe, entry and exit rules, market conditions, and trading costs. Test it before using it with real money.
Can the Indicator Predict Forex Market Reversals?
No indicator can reliably predict every reversal. A change in trend indication can provide a reason to investigate changing conditions, but it does not guarantee that price will reverse.
Can Beginners Use the Age Adaptive SuperTrend Indicator?
Beginners can study it while learning trend analysis, price action, and risk management. They should first understand how the script works and practice using predefined rules in a demo environment.
Should I Use the Indicator Alone?
It is generally more prudent to evaluate the indicator alongside price structure, support and resistance, risk management, and a tested trading plan. Additional indicators should be included only when they provide useful, distinct information.
Does the Indicator Guarantee Profitable Forex Trades?
No. Trading involves substantial risk, and no indicator guarantees profits. Historical performance may differ significantly from live results.
Take Your Forex Trading Education Further
Learning an indicator is only one step toward becoming a more disciplined forex trader. The real challenge is turning technical information into a consistent process for analyzing opportunities, managing risk, and evaluating results.
At Forex Trading Unlocked, our goal is to help traders develop that process through practical forex education, technical analysis, trading strategies, and risk-management resources.
Continue building your skills with these resources:
- Forex Trading Education — Strengthen your understanding of the forex market and its mechanics.
- High-Probability Japanese Candlestick Patterns — Study candlestick formations and their role in price-action analysis.
- MTF Trend Dashboard Indicator Guide — Explore a multi-timeframe approach to evaluating market direction.
- Divergence Scanner Indicator Guide — Learn how divergence analysis can complement trend evaluation.
Ready to Build a More Structured Forex Trading Plan?
Stop jumping from one indicator to the next without a clear process. Study your tools, define your rules, manage your risk, and test your approach before committing capital.
Explore Forex Trading Unlocked, strengthen your technical analysis skills, and take the next step toward more disciplined trading.
Visit Forex Trading Unlocked to continue your education and discover resources designed to help you trade with greater structure and confidence.
Risk Disclosure: Forex trading involves substantial risk and is not suitable for every investor. You can lose some or all of your invested capital. Educational material and technical indicators do not constitute financial advice or guarantee trading results. Always assess your financial circumstances and risk tolerance before trading.
👉 “Get Instant Access (Check Your Email)”
💥 IMPORTANT: One Last Step Required
After you enter your email, check your inbox (or spam folder) for a confirmation email.
👉 Click the confirmation link so I can send you your free Forex training.
⚠️ If you don’t confirm, I can’t send you anything.
👉 “⚠️ Access expires if not confirmed within 24 hours minutes.”
👉 “Takes 10 seconds. Instant access after email confirmation.”