How to Use the Momentum Impulse Wave Indicator on TradingView in Forex Trading
Unlock Forex Trading Opportunities With the Momentum Impulse Wave Indicator
Are you entering Forex trades too early, jumping into trends too late, or struggling to determine whether a price move has enough momentum to continue?
Successful Forex trading requires more than identifying whether the market is moving up or down. You need to evaluate the strength of price movement, recognize potential changes in momentum, and confirm your trading decisions with a disciplined strategy.
The Momentum Impulse Wave Indicator on TradingView can help you analyze market momentum and identify potential opportunities as currency prices develop directional moves. When combined with price action, trend analysis, support and resistance, and sound risk management, this indicator can become a valuable part of your Forex trading toolkit.
In this guide, you will learn how to use the Momentum Impulse Wave Indicator, interpret its signals, identify potential Forex trade setups, and integrate momentum analysis into a more structured trading strategy.
Want to improve your Forex trading skills? Explore the educational resources, technical analysis guides, and trading strategies available at Forex Trading Unlocked.
What Is the Momentum Impulse Wave Indicator?
The Momentum Impulse Wave Indicator is a TradingView charting tool designed to help traders evaluate momentum and visualize potential directional price movements.
Momentum analysis focuses on the strength and persistence of price movement. When a currency pair begins moving decisively in one direction, momentum may help traders assess whether the move has the potential to continue or whether the market could be losing strength.
The indicator's specific calculations, colors, wave formations, and signal rules depend on the version you select on TradingView. Always review the indicator's description and settings before relying on its signals.
Forex traders can use momentum analysis to investigate several important questions:
- Is bullish or bearish momentum developing?
- Is the current trend gaining or losing strength?
- Does a potential trade align with the broader market direction?
- Is a price move supported by other technical evidence?
- Could a momentum change warrant caution or a closer examination of a possible reversal?
The objective is not to predict every market movement. It is to identify potentially favorable trading conditions while controlling risk when the market moves against your position.
Why Momentum Matters in Forex Trading
The Forex market is constantly changing. Currency pairs alternate between trending conditions, consolidations, breakouts, and reversals.
A strategy that works well in a strong trend may perform poorly when the market moves sideways. Likewise, entering a trade after a substantial price move has already occurred can expose you to an unfavorable entry price or a sudden correction.
Momentum analysis helps you examine the character of a move rather than focusing exclusively on the current price.
1. Identify Potential Trend Continuation
When price moves consistently in one direction and momentum analysis supports that direction, traders may investigate opportunities to join the prevailing trend.
For example, if EURUSD is making higher highs and higher lows, a trader may watch for a bullish pullback followed by renewed upward momentum before considering a long position.
2. Recognize Potential Momentum Weakness
A trend can remain intact even when momentum begins to weaken. However, a loss of momentum may signal that the market deserves closer attention.
If GBPUSD continues rising while upward price progress becomes less convincing, a trader may look for additional evidence before entering another long trade.
Momentum weakness alone does not confirm a reversal. Price structure and other technical factors remain important.
3. Improve Trade Timing
Entering a trade simply because price is rising or falling can lead to poor decisions.
A momentum indicator can provide another perspective when evaluating whether a developing move supports your entry conditions. The best results come from using a repeatable checklist instead of reacting emotionally to every signal.
4. Strengthen Your Trading Process
The real advantage of technical analysis comes from combining tools into a consistent process.
The Momentum Impulse Wave Indicator can be evaluated alongside trend direction, candlestick formations, support and resistance, and predefined stop-loss levels.
The goal is to build a trading process—not to depend on one indicator to make every decision.
How to Find the Momentum Impulse Wave Indicator on TradingView
TradingView provides charting tools and community-published indicators that traders can investigate for technical analysis.
Follow these steps to locate the Momentum Impulse Wave Indicator.
- Visit TradingView.
- Open a Forex chart, such as EURUSD, GBPUSD, or USDJPY.
- Select the Indicators tool from the chart interface.
- Search for Momentum Impulse Wave.
- Review the available results and select the version that matches the indicator you want to study.
- Read the author's description, instructions, and any documented limitations.
- Add the indicator to your chart and examine its default settings.
- Test its behavior on historical price data before using it in a live trading environment.
Be aware that similarly named indicators may use different formulas and signal conventions. Do not assume that every version generates identical signals.
For more advanced charting capabilities, explore TradingView resources and learn how technical indicators can fit into a complete Forex trading strategy.
How to Set Up Your Forex Chart
Before evaluating momentum signals, create a chart that makes price action easy to understand.
Step 1: Select a Currency Pair
Start with a major currency pair such as EURUSD or GBPUSD. Major pairs are popular among Forex traders and provide a useful starting point for practicing technical analysis.
Choose a pair you understand and observe how it behaves during different market sessions.
Step 2: Choose a Timeframe
The appropriate timeframe depends on your trading style and available time.
- 5-minute and 15-minute charts: Useful for examining short-term intraday price movements, but often affected by market noise.
- 1-hour and 4-hour charts: Useful for evaluating intraday and swing-trading opportunities.
- Daily charts: Useful for analyzing broader trends and longer-term price structure.
Consider checking a higher timeframe before taking a lower-timeframe entry. This helps you understand whether a short-term signal aligns with the larger market environment.
Step 3: Add the Momentum Impulse Wave Indicator
Search for and add your chosen indicator to the chart.
Observe how its visual elements behave as price rises, falls, consolidates, and changes direction. If the indicator provides configurable settings, understand what each setting controls before making adjustments.
Avoid changing settings simply to make historical signals appear more profitable.
Step 4: Add Price-Action Context
Identify the market's recent swing highs, swing lows, support zones, and resistance zones.
You can also examine candlestick patterns to evaluate potential confirmation around important price levels.
Learn more with the Forex Trading Unlocked guides to Japanese Candlestick Patterns and Forex Trading.
Step 5: Define Your Risk Before Entering
Determine where your trade idea would be invalidated before placing an order.
Your stop-loss placement should reflect the trade setup and market structure, not an arbitrary distance chosen after you enter. Calculate position size based on your stop distance and the amount of capital you are prepared to risk.
Never assume an indicator signal guarantees a profitable outcome.
How to Interpret Momentum Impulse Wave Signals
Because the exact visual signals depend on the version of the indicator you select, begin by confirming its documented rules. The following framework explains how to evaluate momentum conditions without assuming that every version uses the same colors or wave patterns.Bullish Momentum Conditions
A potential bullish opportunity deserves investigation when the broader market structure is rising and the indicator's documented signals support strengthening upward momentum.
Look for supporting evidence such as:
- Price forming higher highs and higher lows.
- A pullback toward a previously established support area.
- A bullish candlestick response near that area.
- A renewed upward move consistent with the indicator's bullish interpretation.
- Sufficient room before the next significant resistance zone.
These conditions can help you evaluate a possible long trade. They do not guarantee that price will continue higher.
Bearish Momentum Conditions
A potential bearish opportunity may develop when market structure is declining and the indicator supports renewed downward momentum.
Consider looking for:
- Price forming lower highs and lower lows.
- A retracement toward a resistance area.
- A bearish candlestick response near resistance.
- Renewed downward movement consistent with the indicator's documented bearish signals.
- Sufficient room before the next significant support zone.
When several independent factors align, the setup may warrant further analysis.
Momentum Changes and Possible Reversals
A change in momentum can attract attention because it may occur before or during a change in market structure.
However, a change in an indicator's appearance does not automatically mean the market has reversed.
Look for additional confirmation, such as a break of a meaningful swing level, a failed attempt to extend the existing trend, or a candlestick pattern developing at an important support or resistance zone.
Patience is essential. Waiting for confirmation can help you avoid treating every temporary fluctuation as a major trading opportunity.
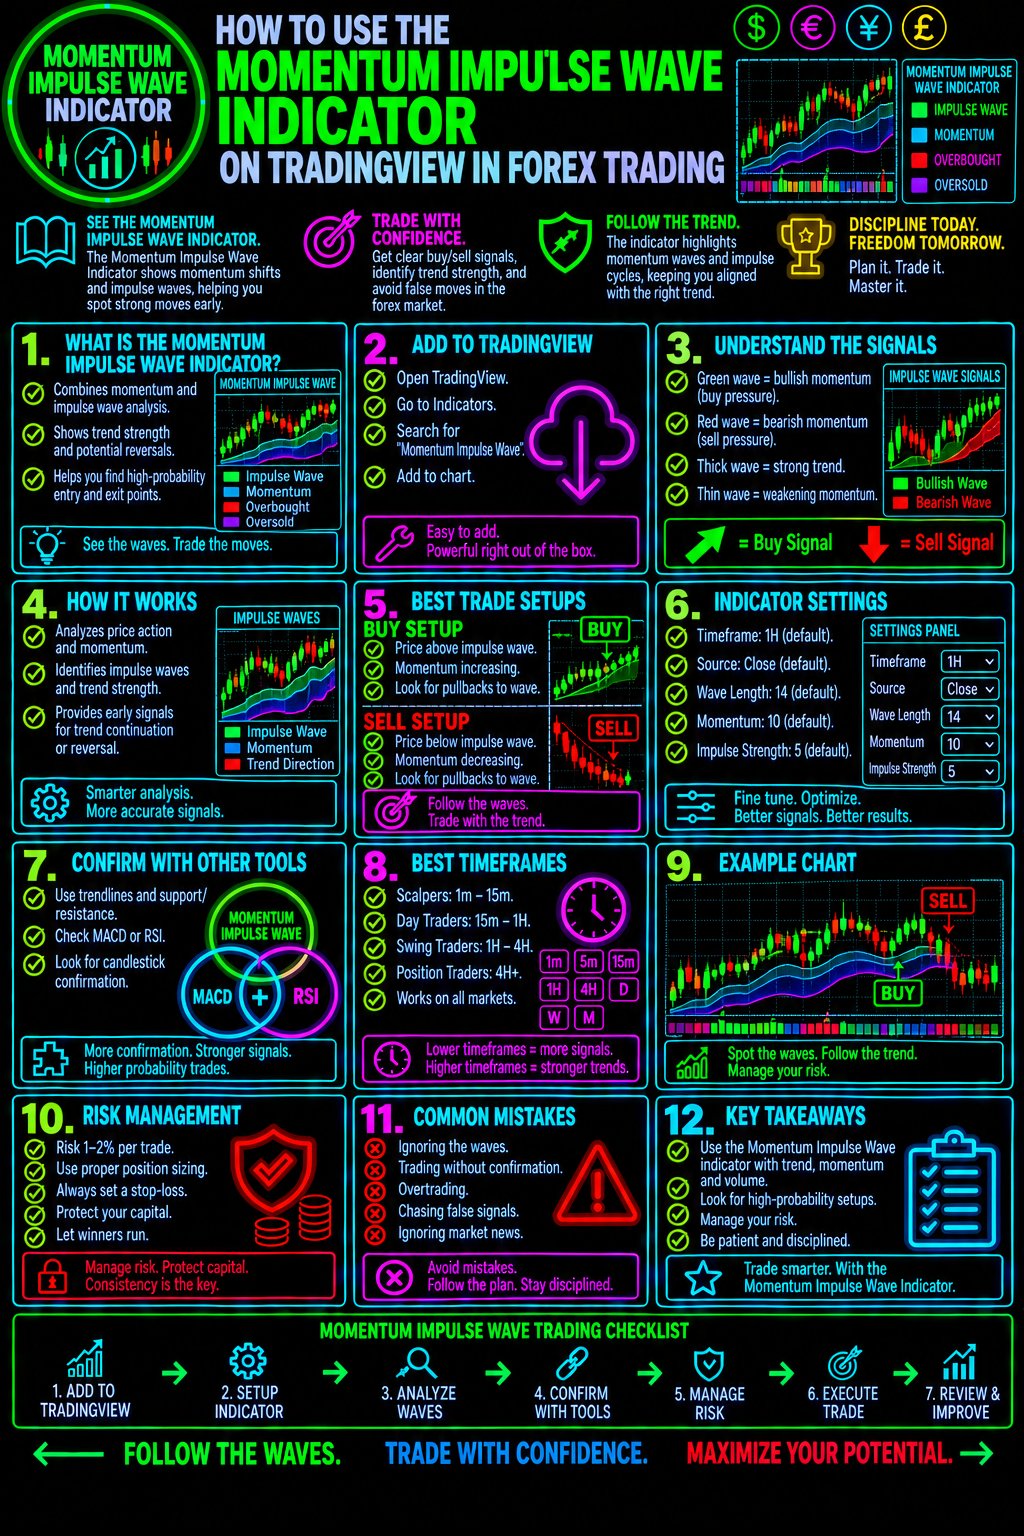
A Practical Momentum Impulse Wave Forex Trading Strategy
The following framework combines momentum analysis with trend direction, price action, and risk management. It is a strategy to test and refine—not a claim that the indicator has a verified win rate.Bullish Setup: Trading With Upward Momentum
Step 1: Establish the trend.
Examine the higher timeframe. Look for a sequence of higher highs and higher lows or other clear evidence of upward market structure.
Step 2: Identify a potential entry area.
Mark a support zone or a previous breakout area where price could potentially resume its upward movement.
Step 3: Wait for a pullback.
Avoid chasing an extended bullish candle. Allow price to retrace toward your planned area and observe how it responds.
Step 4: Evaluate momentum.
Check whether the Momentum Impulse Wave Indicator's documented bullish conditions support the developing setup.
Step 5: Seek price-action confirmation.
Look for a convincing bullish response, such as a strong rejection of lower prices or a relevant bullish candlestick formation.
Step 6: Define entry, stop-loss, and target.
Choose an entry trigger, identify the price level that invalidates the trade, and establish a realistic profit target based on market structure.
Step 7: Calculate position size.
Determine your position size from your account equity, risk limit, stop distance, and the currency pair's contract specifications.
Only consider the trade if the potential reward justifies the risk under your predefined rules.
Bearish Setup: Trading With Downward Momentum
Step 1: Establish the bearish trend.
Look for lower highs, lower lows, and other evidence of declining market structure.
Step 2: Identify resistance.
Mark a previous swing high, resistance zone, or broken support area that could act as resistance during a retracement.
Step 3: Wait for price to retrace.
Allow price to return toward the planned area instead of entering simply because a large bearish candle has appeared.
Step 4: Evaluate bearish momentum.
Check whether the indicator's documented bearish conditions align with the broader trend.
Step 5: Look for confirmation.
A bearish rejection candle or another relevant price-action signal may strengthen the trade rationale.
Step 6: Establish trade parameters.
Define your entry trigger, stop-loss, target, and position size before placing the trade.
Step 7: Manage the position consistently.
Follow your predefined management rules rather than making impulsive changes because of short-term price fluctuations.
Combine Momentum Analysis With Japanese Candlestick Patterns
Candlestick analysis can help you examine the price behavior surrounding a potential momentum signal.
For example, a bullish engulfing pattern near a support zone may provide useful context when a trader is evaluating a possible upward momentum shift. A bearish engulfing pattern near resistance may provide context for a potential downward move.
Other formations, including hammer and shooting star patterns, can also be studied in relation to important price levels.
The location of the pattern matters. A candlestick formation in the middle of an unstructured market may be less compelling than one developing at a clearly defined support or resistance zone.
Explore the High Probable Japanese Candlestick Patterns Guide to develop a stronger understanding of candlestick-based trade analysis.
Build your edge by combining evidence—not by collecting more indicators.
Use Support and Resistance to Filter Momentum Signals
Support and resistance provide a framework for understanding where price may encounter buying or selling pressure.
A bullish momentum signal developing near a meaningful support zone may deserve closer attention than one appearing directly beneath major resistance.
Likewise, a bearish signal near a resistance zone may offer a clearer trade rationale than one appearing immediately above substantial support.
Before entering a trade, ask yourself:
- Where is the nearest significant support or resistance?
- Is there enough room for price to move toward my target?
- Does the entry align with the prevailing market structure?
- Has price confirmed the setup, or am I anticipating a move without sufficient evidence?
- Does the potential reward justify the risk?
Use the Forex Trading Unlocked website to explore additional technical analysis lessons and develop a more complete trading process.
Multi-Timeframe Analysis: Confirm the Bigger Picture
A momentum signal can appear bullish on a short-term chart while the broader market remains bearish.
Multi-timeframe analysis helps you place individual signals into context.
For example, a trader analyzing EUR/USD might:
- Examine the daily chart to identify the broader trend and major price levels.
- Review the 4-hour chart to locate the current market structure and potential trading zones.
- Use the 1-hour chart to evaluate the entry setup and its relationship to momentum.
This process does not eliminate losing trades. It can, however, help traders avoid making decisions based entirely on a single timeframe.
Choose timeframes that match your strategy and use the same process consistently when testing your results.
Common Mistakes to Avoid When Using the Momentum Impulse Wave Indicator
Even a useful technical indicator can produce poor trading decisions when it is applied without a clear plan.
Mistake 1: Treating Every Signal as a Trade
Indicators can generate signals during choppy conditions and false breakouts.
Better approach: Require your predefined trend, price-action, and risk criteria to be satisfied before considering an entry.
Mistake 2: Ignoring the Overall Trend
A short-term bullish signal may appear during a strong bearish trend, and the opposite can also occur.
Better approach: Evaluate the higher-timeframe market structure before making a trading decision.
Mistake 3: Entering After an Extended Move
A strong momentum reading may appear after much of a move has already occurred.
Better approach: Identify potential pullback zones and establish entry criteria before price reaches them.
Mistake 4: Using Too Many Indicators
Adding multiple indicators can create conflicting signals and make a strategy harder to evaluate.
Better approach: Start with a small set of complementary tools, such as momentum analysis, price structure, and candlestick confirmation.
Mistake 5: Failing to Use a Stop-Loss Plan
A promising setup can fail unexpectedly because of economic announcements, volatility, or changing market conditions.
Better approach: Define your invalidation level and position size before entering the market.
Mistake 6: Assuming Historical Signals Guarantee Future Results
An indicator's historical appearance does not establish that it will produce profitable results in live trading.
Better approach: Backtest the complete strategy, account for transaction costs and slippage, and evaluate it across different market conditions.
How to Backtest the Momentum Impulse Wave Forex Strategy
Before committing real capital, test the indicator as part of a complete trading system.
A useful testing process includes:
- Document your rules. Define the trend criteria, entry trigger, stop-loss placement, profit target, and conditions for skipping a trade.
- Select a currency pair and timeframe. Start with a manageable testing scope.
- Review historical setups. Examine both successful and unsuccessful examples without changing your rules after every trade.
- Include trading costs. Account for spreads, commissions where applicable, and realistic slippage.
- Record every trade. Track entry, exit, risk, outcome, and whether you followed your strategy.
- Evaluate a meaningful sample. Avoid drawing conclusions from a handful of trades.
- Test different market conditions. Examine trending markets, consolidations, and volatile periods.
- Forward-test the rules. Use a demo account to see how the system performs as new price data develops.
Measure more than the win rate. Average profit, average loss, drawdown, expectancy, and consistency all matter.
A strategy with a high win rate can still lose money if its average loss is much larger than its average profit. Conversely, a strategy with a lower win rate may be viable if its winners sufficiently compensate for its losses and costs.
Your objective is to establish whether the complete strategy has a credible, repeatable advantage—not simply whether the indicator looks attractive on a chart.
Frequently Asked Questions
What does the Momentum Impulse Wave Indicator do?
It is a TradingView charting tool intended to help traders analyze momentum and potential directional price movement. Its precise signals and calculations depend on the specific version used.
Is the Momentum Impulse Wave Indicator suitable for beginners?
Beginners can study it as part of their technical analysis education. Start with a demo account, learn how the indicator works, and understand trend structure, support and resistance, and risk management before trading live.
Can I use the Momentum Impulse Wave Indicator for scalping?
Potentially, depending on the indicator's behavior and the strategy being tested. Scalping requires attention to spreads, execution costs, short-term volatility, and the possibility of false signals. Backtest and forward-test your rules before using real capital.
Can I use it for swing trading?
Yes, you can evaluate momentum indicators on higher timeframes for potential swing-trading setups. The suitability of a particular version depends on its documented behavior and how well it integrates with your trading rules.
Does the indicator predict Forex reversals?
No indicator can reliably predict every reversal. Momentum changes can alert traders to conditions worth investigating, but confirmation from price structure and other technical evidence remains important.
What is the best timeframe for the Momentum Impulse Wave Indicator?
There is no universally best timeframe. The appropriate choice depends on your trading style, the currency pair, and the rules of your strategy. Test multiple timeframes systematically rather than selecting one based on a few favorable examples.
Should I use the indicator by itself?
It is generally more prudent to evaluate it within a broader framework that includes market structure, price action, trade planning, and risk management. No single indicator guarantees profitable trades.
Take Your Forex Trading Education to the Next Level
Learning to interpret momentum is one step toward becoming a more disciplined Forex trader. The next step is developing a repeatable process that combines technical analysis, trade selection, risk management, and ongoing performance evaluation.
At Forex Trading Unlocked, you can continue building your skills with educational resources designed to help you understand the Forex market and make more informed trading decisions.
Explore these resources next:
- Forex Trading Guide — Strengthen your understanding of the Forex market and trading fundamentals.
- High Probable Japanese Candlestick Patterns — Learn how candlestick formations can support price-action analysis.
- High-Probability Japanese Candlestick Patterns Every Trader Must Know — Explore essential candlestick formations for your trading toolkit.
- Forex Trading Unlocked Home Page — Discover more Forex trading lessons, strategies, and educational resources.
- TradingView — Explore charting tools for analyzing currency markets and testing your trading ideas.
Ready to Build a More Disciplined Forex Trading Strategy?
Stop relying on guesswork. Learn to evaluate momentum, identify meaningful price levels, confirm potential setups, and manage risk before you enter a trade.
Explore the educational resources at Forex Trading Unlocked and take the next step toward building a more structured approach to Forex trading.
Study the setup. Confirm the conditions. Define the risk. Execute your plan.
Risk Disclosure: Forex and leveraged trading involve substantial risk and may not be suitable for every trader. Losses can exceed expectations, depending on the product and account arrangements. Technical indicators are analytical tools, not guarantees of future performance. Always test trading strategies thoroughly and trade only with money you can afford to lose.
👉 “Get Instant Access (Check Your Email)”
💥 IMPORTANT: One Last Step Required
After you enter your email, check your inbox (or spam folder) for a confirmation email.
👉 Click the confirmation link so I can send you your free Forex training.
⚠️ If you don’t confirm, I can’t send you anything.
👉 “⚠️ Access expires if not confirmed within 24 hours minutes.”
👉 “Takes 10 seconds. Instant access after email confirmation.”