How To Use The Support And Resistance Power Channel Indicator On TradingView In Forex Trading
Master Key Price Levels. Spot Potential Breakouts. Build Better Forex Trade Setups.
Support and resistance are two of the most important concepts in Forex trading—but identifying meaningful levels consistently can be difficult.
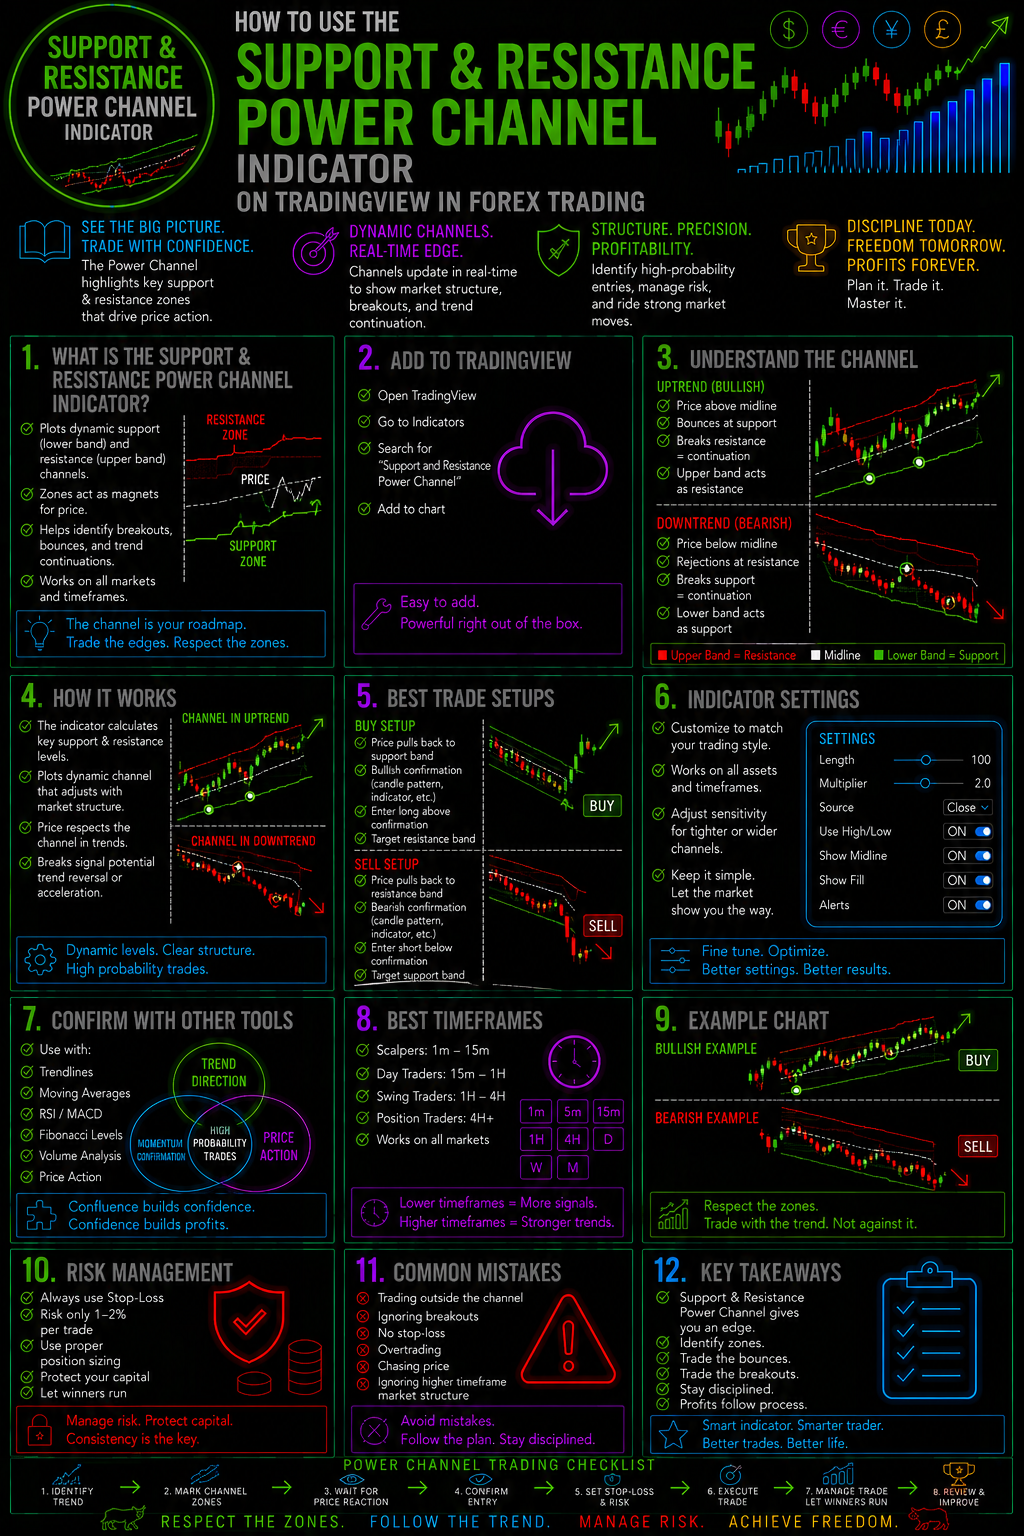
The Support And Resistance Power Channel Indicator on TradingView gives traders a visual framework for analyzing price behavior around important support and resistance zones.
Instead of relying on random horizontal lines or trying to identify every possible price level on a chart, traders can use the indicator to help organize the market into potentially important areas where price may react, consolidate, reverse, or break through.
And when you combine those levels with trend analysis, price action, Japanese candlestick patterns, momentum, and disciplined risk management, support and resistance can become a powerful part of a complete Forex trading strategy.
This guide shows you how to use the Support And Resistance Power Channel Indicator on TradingView—and, more importantly, how to think about the information it provides.
What Is The Support And Resistance Power Channel Indicator?
The Support And Resistance Power Channel Indicator is a TradingView charting tool designed to help traders visualize areas of potential support and resistance.
These areas can help identify where buying or selling pressure may become important.
Support represents an area where downward price movement may encounter buying interest.
Resistance represents an area where upward price movement may encounter selling interest.
But markets rarely respect a single exact price.
That is why thinking in terms of zones and channels can be more useful than assuming support or resistance exists at one perfect number.
The indicator can help traders see these areas directly on their charts, allowing them to study how price behaves as it approaches, tests, rejects, or breaks through important levels.Why This Matters In Forex Trading
Forex markets constantly move between periods of:
- Trending
- Consolidation
- Breakouts
- Pullbacks
- Reversals
- Volatility expansion
- Volatility contraction
Support and resistance can provide important context during each of these market conditions.
The real opportunity isn't simply knowing where support and resistance are.
It's understanding what price does when it gets there.
How To Add The Indicator To TradingView
Getting started is straightforward.
Open your TradingView chart and search for the Support And Resistance Power Channel Indicator within the Indicators section.
Once added, adjust the indicator settings according to your trading style, timeframe, and market.
Do not assume that the default settings are automatically the best settings for your Forex strategy.
Different currency pairs and timeframes can produce very different market structures.
A setting that works well for one trading approach may generate too much information—or too little—for another.Start Simple
Before changing numerous parameters, begin by studying the indicator using its default configuration.
Look at:
- Where support zones develop
- Where resistance zones develop
- How price reacts to those areas
- How often levels are tested
- What happens after a breakout
- Whether the indicator behaves differently across timeframes
Your objective should be to understand the indicator before attempting to optimize it.
How To Read Support And Resistance Power Channels
The most important skill is learning how to interpret the zones in the context of price action.
Think of a support or resistance channel as an area of interest, not an automatic buy or sell signal.
When price approaches support, ask:
Is price rejecting the area?
Is bearish momentum weakening?
Are bullish candlesticks appearing?
Is the broader trend bullish?
When price approaches resistance, ask:
Is price being rejected?
Is bullish momentum weakening?
Are bearish candlesticks appearing?
Is the broader trend bearish?
These questions transform the indicator from a simple visual tool into part of a larger decision-making process.
Support: Where Buyers May Become More Active
Support is an area where price has historically found buying interest.
When price approaches a support channel, traders can watch for evidence that sellers are losing control.
Potential confirmation can include:
- Bullish rejection candles
- Pin bars
- Bullish engulfing patterns
- Higher lows
- Momentum shifts
- Breaks of short-term resistance
- Bullish divergence
- Strong increases in buying pressure
The support zone itself does not guarantee a reversal.
Instead, it gives you a location where a reversal may become worth investigating.
That distinction is critical.
Resistance: Where Sellers May Become More Active
Resistance works from the opposite perspective.
As price approaches a resistance channel, traders can monitor whether buyers are beginning to lose momentum.
Potential confirmation can include:
- Bearish rejection candles
- Shooting stars
- Bearish engulfing patterns
- Lower highs
- Momentum deterioration
- Breaks of short-term support
- Bearish divergence
- Increased selling pressure
Again, resistance isn't an automatic sell signal.
It is a potential decision zone.
Your job as a trader is to wait for price action and market conditions to provide additional evidence.
The Most Powerful Way To Use The Indicator: Confluence
One of the biggest mistakes traders make is treating a single indicator as a complete trading system.
Don't.
The Support And Resistance Power Channel Indicator can become considerably more useful when combined with other forms of technical analysis.
This is where confluence becomes important.
For example:
Support Zone + Bullish Candlestick Pattern + Uptrend + Momentum Confirmation
can create a much more compelling bullish setup than support alone.
Likewise:
Resistance Zone + Bearish Candlestick Pattern + Downtrend + Momentum Confirmation
can create a stronger bearish scenario than resistance alone.
The goal isn't to add dozens of indicators.
The goal is to combine a small number of complementary signals that answer different questions.
Combine Support And Resistance With Japanese Candlesticks
Japanese candlesticks can provide the price-action confirmation that support and resistance analysis needs.
Imagine EURUSD approaches a major support channel.
The indicator identifies the area.
Price enters the zone.
Then a bullish rejection candle forms.
Price subsequently breaks above the previous candle's high.
That sequence may provide considerably more information than simply seeing price touch support.
The same principle applies at resistance.
A resistance zone followed by a bearish rejection pattern can potentially provide an early warning that buyers are losing control.
This is where understanding high-probability Japanese candlestick patterns can become extremely valuable.
Don't just identify the level. Learn to read the reaction.
Use Multiple Timeframes For Better Context
Another powerful way to use the Support And Resistance Power Channel Indicator is through multiple timeframe analysis.
A level appearing on a five-minute chart doesn't necessarily have the same significance as a level visible on a four-hour or daily chart.
For example, you might analyze:Daily Chart
Identify the major market structure and significant support/resistance areas.4-Hour Chart
Study the intermediate trend and important reaction zones.1-Hour Chart
Look for developing trade opportunities.15-Minute Chart
Fine-tune the potential entry.
This creates a hierarchy of information.
The higher timeframe provides context.
The lower timeframe provides execution detail.
Support Can Become Resistance
One of the most important concepts to understand is the role reversal between support and resistance.
When price breaks decisively below a support area, that previous support can potentially become resistance.
Likewise, when price breaks above resistance, that previous resistance can potentially become support.
This creates an important trading scenario.Example
EUR/USD approaches resistance.
Price breaks above the resistance channel.
Instead of immediately chasing the breakout, the trader waits.
Price pulls back toward the previous resistance.
The former resistance now acts as potential support.
If bullish price action develops at that retest, the trader may have a more structured breakout-and-retest setup.
This approach can help traders avoid entering after an extended move.
How To Trade Breakouts With The Indicator
Breakouts can create some of the fastest Forex moves.
But they can also produce false signals.
That makes confirmation extremely important.
When price approaches a resistance channel, watch for:
- Price compression near resistance.
- Increasing bullish pressure.
- A breakout through the resistance zone.
- A candle close confirming the move.
- A potential retest.
- Confirmation that the former resistance can hold as support.
For bearish breakouts, reverse the process.
The key lesson is simple:
A price spike through resistance is not automatically a confirmed breakout.
Wait for evidence.
Beware Of False Breakouts
False breakouts are one of the biggest challenges when trading support and resistance.
Price can temporarily move through a level, trigger breakout entries, and then reverse sharply.
This is why traders should consider:
- Candle closes
- Market structure
- Momentum
- Volume where appropriate
- Higher timeframe direction
- Retests
- Volatility
- News events
A breakout occurring immediately before a major economic announcement can behave very differently from a technically driven breakout during normal market conditions.
The indicator helps identify the location.
It does not eliminate market uncertainty.
A Simple Support And Resistance Trading Process
Instead of randomly looking for trades, build a repeatable process.
Step 1: Identify The Trend
Determine whether the market is broadly bullish, bearish, or ranging.
Step 2: Identify The Important Channels
Use the indicator to locate significant support and resistance areas.
Step 3: Wait For Price
Do not chase the market.
Let price come to the area.
Step 4: Study The Reaction
Look for rejection, consolidation, breakout, or reversal behavior.
Step 5: Seek Confluence
Add price action, candlestick patterns, momentum, or other confirmation.
Step 6: Define Your Risk
Know exactly where the trade thesis becomes invalid.
Step 7: Plan The Target
Look toward the next important support or resistance area.
Step 8: Execute Without Emotion
Once the setup meets your predefined criteria, follow your trading plan.
This process turns support and resistance from something you simply see into something you can systematically trade around.
Support And Resistance For Range-Bound Markets
The indicator can also be useful when Forex markets are moving sideways.
In a range, traders may see price repeatedly move between an upper resistance area and lower support area.
Instead of attempting to predict every small movement, traders can focus on how price behaves near the boundaries of the range.
Near support:
Look for bullish confirmation.
Near resistance:
Look for bearish confirmation.
But be careful.
Eventually, the range may break.
That means range traders must remain alert for a genuine breakout and changing market structure.
Support And Resistance In Trending Markets
Support and resistance aren't only useful for reversals.
They can also help traders trade with the trend.
During a bullish trend, previous resistance areas may become future support.
During a bearish trend, previous support areas may become future resistance.
This can create pullback opportunities.
For example:
Uptrend → Breakout → Pullback → Former Resistance Becomes Support → Bullish Confirmation
That sequence can offer a more structured entry than chasing price after a large bullish candle.
Risk Management Comes First
No support or resistance indicator can predict the future with certainty.
A perfect-looking setup can fail.
That is why risk management must remain at the center of your trading strategy.
Before entering a trade, know:
- Your entry
- Your stop-loss
- Your position size
- Your maximum acceptable loss
- Your potential target
- Your risk-to-reward relationship
- The conditions that invalidate the setup
Never increase your position simply because you believe a support or resistance level "must" hold.
The market doesn't owe traders a reversal.
Your job isn't to be right every time. Your job is to manage risk when you're wrong.
Common Mistakes Traders Make
Mistake #1: Treating Every Level As Equal
Not every support or resistance area carries the same significance.
Higher-timeframe levels and areas repeatedly respected by price may deserve greater attention.
Mistake #2: Entering Immediately At The Level
Touching support doesn't automatically mean buy.
Touching resistance doesn't automatically mean sell.
Wait for confirmation.
Mistake #3: Chasing Breakouts
A large candle through resistance can tempt traders into entering late.
Waiting for confirmation or a retest can create a more structured approach.
Mistake #4: Ignoring The Larger Trend
A bullish setup against a powerful bearish trend deserves additional scrutiny.
Always understand the larger market structure.
Mistake #5: Using Too Many Indicators
More indicators don't automatically produce better trades.
Build a clean decision-making process.
Mistake #6: Ignoring Economic News
Forex markets can move dramatically around interest-rate decisions, inflation reports, employment data, central-bank announcements, and other major economic events.
Technical levels can be overwhelmed by fundamental catalysts.
Build Your Forex Trading System Around Confluence
The Support And Resistance Power Channel Indicator should be viewed as one component of a larger trading framework.
A powerful framework might include:
Market Structure
↓
Support & Resistance
↓
Trend Direction
↓
Candlestick Confirmation
↓
Momentum
↓
Entry Trigger
↓
Risk Management
↓
Trade Management
This creates a decision-making process rather than a dependence on one indicator.
And that's the difference between simply putting indicators on a chart and actually building a trading methodology.
Take Your Forex Trading Beyond One Indicator
If you're serious about becoming a more disciplined Forex trader, don't stop at learning one TradingView indicator.
Explore the complete Forex Trading Unlocked education library and learn how different pieces of technical analysis can work together.
Continue Learning:
- Learn How To Use The Trend State Signals Indicator
- Learn How To Use The Two-Pole Oscillator Indicator
- Learn How To Use The Momentum Bias Index Indicator
- Learn How To Use The Triple Confluence Navigator Indicator
- Learn How To Use The Supertrend Extensions Indicator
- Learn How To Use The Bullish & Bearish Reversal Bars Indicator
- Learn How To Use The DIY Custom Strategy Builder Indicator
- Explore Forex Trading Strategies
- Explore Japanese Candlestick Patterns
- Learn Forex Risk Management
Don't make your TradingView chart more complicated. Make your trading decisions more intelligent.
Ready To Become A More Confident Forex Trader?
Knowing where support and resistance are is only the beginning.
The real edge comes from knowing what to do when price reaches those levels.
That's why Forex Trading Unlocked focuses on practical trading education designed to help traders understand market structure, price action, technical analysis, risk management, and real-world trade execution.
If you're ready to go beyond random indicators and start developing a structured approach to Forex trading, now is the time to take the next step.Explore Forex Trading Unlocked
Learn. Analyze. Execute. Improve.
START YOUR FOREX TRADING JOURNEY →
Frequently Asked Questions
What is the Support And Resistance Power Channel Indicator?
It is a TradingView indicator designed to help traders identify and visualize potential support and resistance areas on a price chart.
How do you use the Support And Resistance Power Channel Indicator in Forex?
Use the indicator to identify potential support and resistance zones, then analyze how price behaves around those areas. Combine the zones with market structure, trend direction, candlestick patterns, momentum, and risk management.
Is the Support And Resistance Power Channel Indicator a complete trading strategy?
No. An indicator should generally be considered a component of a trading strategy rather than a guarantee of future price movement.
Can the indicator be used for scalping?
Potentially, yes. However, lower timeframes can contain significantly more market noise. Traders should test their settings and strategy before risking capital.
Can it be used for swing trading?
Yes. Support and resistance analysis can be applied across multiple timeframes, including those commonly used for swing trading.
Should I use multiple indicators with it?
You can, but more indicators aren't necessarily better. Focus on complementary tools that provide useful confirmation rather than redundant signals.
Can support become resistance?
Yes. After a decisive breakdown, a previous support area can potentially become resistance. The reverse can occur when resistance is broken and subsequently acts as support.
Does the indicator guarantee profitable trades?
No. No technical indicator can guarantee profitable trades. Forex trading involves substantial risk, and proper position sizing and risk management are essential.
The Bottom Line
The Support And Resistance Power Channel Indicator on TradingView can give Forex traders a structured way to identify important areas on the chart.
But the indicator itself isn't the edge.
The edge comes from how you interpret the information.
Use support and resistance to identify areas of interest.
Use market structure to understand context.
Use candlesticks to study price reaction.
Use momentum to evaluate strength.
Use multiple timeframes to improve perspective.
And use risk management to protect your trading capital.
That's how you move from simply watching a TradingView chart to developing a more structured Forex trading process.
The market will always create another setup. Your capital needs to survive long enough to trade it.
👉 “Get Instant Access (Check Your Email)”
💥 IMPORTANT: One Last Step Required
After you enter your email, check your inbox (or spam folder) for a confirmation email.
👉 Click the confirmation link so I can send you your free Forex training.
⚠️ If you don’t confirm, I can’t send you anything.
👉 “⚠️ Access expires if not confirmed within 24 hours minutes.”
👉 “Takes 10 seconds. Instant access after email confirmation.”